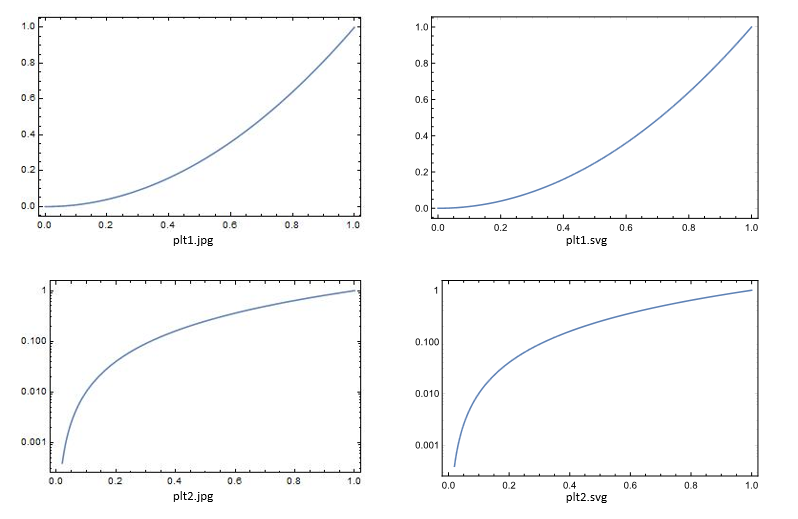
The following code and image shows that the FrameStyle directive of a LogPlot does not show correctly when exported to SVG (tickmarks on vertical axis are missing), but does show properly for JPG. Plot shows correctly when exported SVG and JPG. (There may also be an issue with GridLinesStyle in SVG.)
Is there a workaround to show FrameStyle correctly in SVG?
I'm running Mathematica 11.1.1.0 in Windows 10 Pro, v 1709.
Thanks.
Glenn
plt1 = Plot[x^2, {x, 0, 1}, Frame -> True,
   FrameStyle -> Directive[Black]];
plt2 = LogPlot[x^2, {x, 0, 1}, Frame -> True,
   FrameStyle -> Directive[Black]];

Export["plt1.jpg", plt1];
Export["plt1.svg", plt1];
Export["plt2.jpg", plt2];
Export["plt2.svg", plt2];