Hi Enrique,
you can begin in a very straightforward manner like so:
data0 = Import["sample1.csv", "CSV"];
years = DateObject[{#}] & /@ data0[[1, -4 ;;]];
data1 = Association[#1[[1]] -> <|#1[[2]] -> <|Thread[Rule[years, #1[[3 ;;]]]]|>, #2[[2]] -> <|Thread[Rule[years, #2[[3 ;;]]]]|>|> & @@@ Partition[Rest[data0], 2]];
ds = Dataset[data1];
In this nice form of a Dataset one has a very direct access to every single element, e.g.:
yr = Key@*DateObject@*List;
ds["Algeria", "Population", yr@1961]
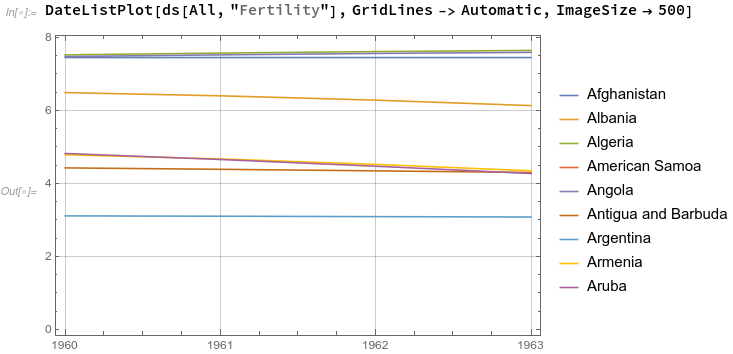
and the overall picture can be made visible easily, e.g.
As for a start I hope that helps, regards -- Henrik


