Group Abstract Group Abstract

Message Boards Message Boards

Fading curves based on a function?

Posted 7 years ago

I have some code that outputs what I want, although I may change the function later. However, I want the output to be like a screenshot I have provided, such that it fades as with the properties of another function.

Here is the code:

ClearAll["Global`*"]; xi = 2; k0 = 9; Print["k0=", k0, " xi=", xi]; \
Show[Table[
  sol = NDSolve[{D[xtraj[t], 
       t] == (Sinh[
         xtraj[t] (t - xi)])/((Cos[xtraj[t]]) + (Cosh[ 
           xtraj[t] (t - xi)])), xtraj[0] == n}, xtraj[t], {t, 0, 4}];
  ParametricPlot[{t, xtraj[t]} /. sol, {t, 0, 4}, PlotRange -> All, 
   PlotStyle -> {Blue, Full, Medium}, AxesStyle -> Thickness[.003], 
   LabelStyle -> {Black, Medium}, AxesLabel -> {xtraj, t}], {n, -4, 
   4 - 0.5, 0.5}]]

Here is the output - or a simplified version of it:
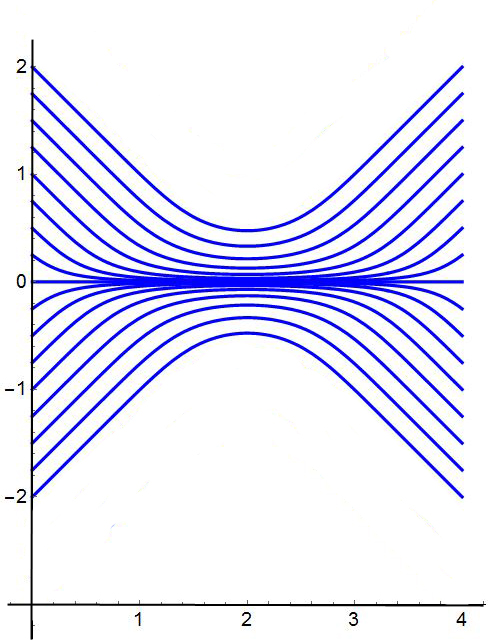
enter image description here

And now this is what I would like - the fading is based upon another function - given below. enter image description here
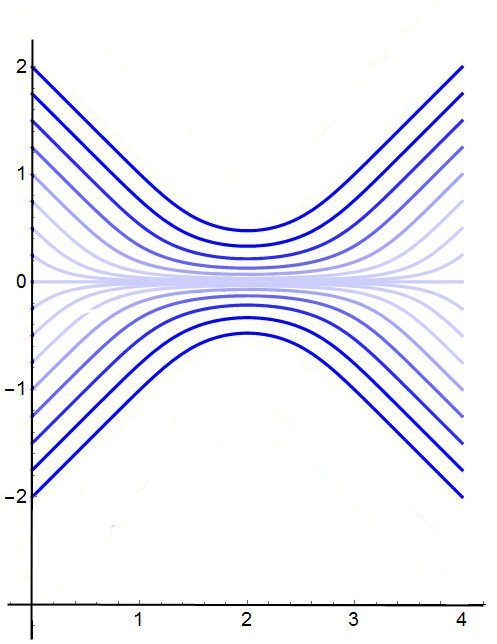
Here is the fading function:

(E^(-2 (-2 + t + x)^2) Sqrt[2 \[Pi]] (1 + E^(8 (-2 + t) x) + 2 E^(4 (-2 + t) x) Cos[10 x]))

It is a tricky one that I really would like to solve.

POSTED BY: Betty Boo
6 Replies
Posted 7 years ago

Thanks that is very helpful.

POSTED BY: Betty Boo

This may be closer to what you want:

xi = 2; k0 = 9;
fadingFunction[t_, 
   x_] = (E^(-2 (-2 + t + x)^2) Sqrt[
     2 \[Pi]] (1 + E^(8 (-2 + t) x) + 2 E^(4 (-2 + t) x) Cos[10 x]));
sol = ParametricNDSolveValue[{D[xtraj[t], 
      t] == (Sinh[
        xtraj[t] (t - xi)])/((Cos[xtraj[t]]) + (Cosh[
          xtraj[t] (t - xi)])), xtraj[0] == n}, xtraj, {t, 0, 4}, {n}];
Plot[Table[sol[n][t], {n, -4, 4 - 0.5, 0.5}], {t, 0, 4}, 
 PlotRange -> All, 
 ColorFunction -> 
  Function[{t, x}, 
   Blend[{Blue, White}, 
    Rescale[ArcTan[fadingFunction[t, x]], {0, Pi/2}]]], 
 ColorFunctionScaling -> False]
POSTED BY: Gianluca Gorni

Mine was just a hint in a general direction. I leave it to you to fine-tune it.

POSTED BY: Gianluca Gorni
Posted 7 years ago

I understand but to make the function fade this will not work, I've already tried it but thanks.

POSTED BY: Betty Boo
Posted 7 years ago
POSTED BY: Betty Boo

Have you tried ColorFunction and ColorFunctionScaling? For example

xi = 2; k0 = 9; Show[
 Table[sol = 
   NDSolve[{D[xtraj[t], 
       t] == (Sinh[
         xtraj[t] (t - xi)])/((Cos[xtraj[t]]) + (Cosh[
           xtraj[t] (t - xi)])), xtraj[0] == n}, 
    xtraj[t], {t, 0, 4}];
  ParametricPlot[{t, xtraj[t]} /. sol, {t, 0, 4}, PlotRange -> All, 
   ColorFunction -> 
    Function[{x, y}, Directive[Opacity[Abs[y]/4], Blue]], 
   ColorFunctionScaling -> False], {n, -4, 4 - 0.5, 0.5}]]
POSTED BY: Gianluca Gorni
Reply to this discussion
Community posts can be styled and formatted using the Markdown syntax.
Reply Preview
Attachments
Remove
or Discard