Message Boards Message Boards

Fading curves based on a function?

Posted 6 years ago

I have some code that outputs what I want, although I may change the function later. However, I want the output to be like a screenshot I have provided, such that it fades as with the properties of another function.

Here is the code:

ClearAll["Global`*"]; xi = 2; k0 = 9; Print["k0=", k0, " xi=", xi]; \
Show[Table[
  sol = NDSolve[{D[xtraj[t], 
       t] == (Sinh[
         xtraj[t] (t - xi)])/((Cos[xtraj[t]]) + (Cosh[ 
           xtraj[t] (t - xi)])), xtraj[0] == n}, xtraj[t], {t, 0, 4}];
  ParametricPlot[{t, xtraj[t]} /. sol, {t, 0, 4}, PlotRange -> All, 
   PlotStyle -> {Blue, Full, Medium}, AxesStyle -> Thickness[.003], 
   LabelStyle -> {Black, Medium}, AxesLabel -> {xtraj, t}], {n, -4, 
   4 - 0.5, 0.5}]]

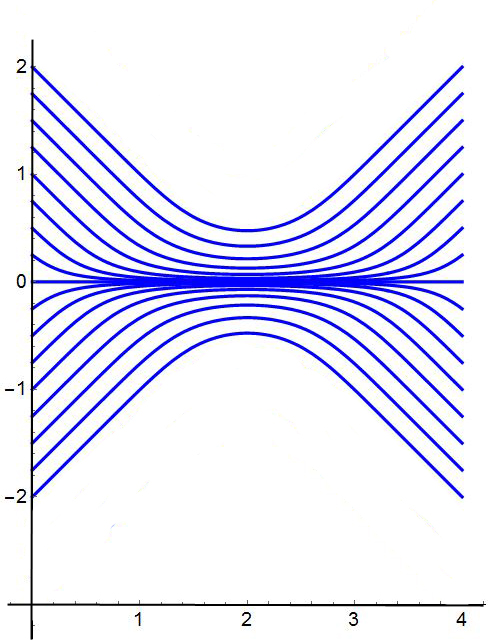
Here is the output - or a simplified version of it:

enter image description here

And now this is what I would like - the fading is based upon another function - given below. enter image description here

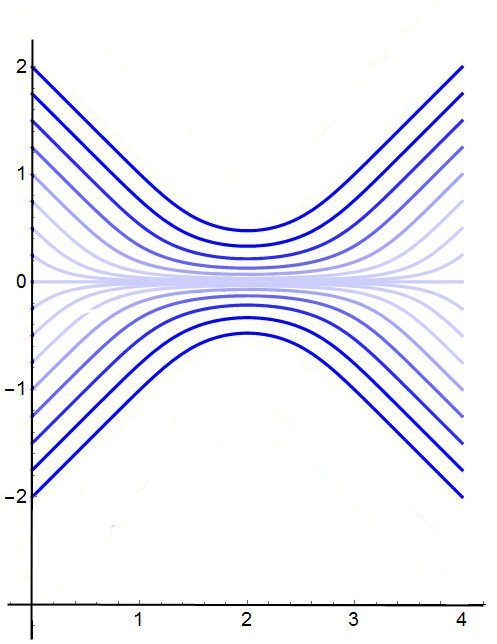
Here is the fading function:

(E^(-2 (-2 + t + x)^2) Sqrt[2 \[Pi]] (1 + E^(8 (-2 + t) x) + 2 E^(4 (-2 + t) x) Cos[10 x]))

It is a tricky one that I really would like to solve.

POSTED BY: Betty Boo
6 Replies
Posted 6 years ago

Thanks that is very helpful.

POSTED BY: Betty Boo

This may be closer to what you want:

xi = 2; k0 = 9;
fadingFunction[t_, 
   x_] = (E^(-2 (-2 + t + x)^2) Sqrt[
     2 \[Pi]] (1 + E^(8 (-2 + t) x) + 2 E^(4 (-2 + t) x) Cos[10 x]));
sol = ParametricNDSolveValue[{D[xtraj[t], 
      t] == (Sinh[
        xtraj[t] (t - xi)])/((Cos[xtraj[t]]) + (Cosh[
          xtraj[t] (t - xi)])), xtraj[0] == n}, xtraj, {t, 0, 4}, {n}];
Plot[Table[sol[n][t], {n, -4, 4 - 0.5, 0.5}], {t, 0, 4}, 
 PlotRange -> All, 
 ColorFunction -> 
  Function[{t, x}, 
   Blend[{Blue, White}, 
    Rescale[ArcTan[fadingFunction[t, x]], {0, Pi/2}]]], 
 ColorFunctionScaling -> False]
POSTED BY: Gianluca Gorni
Posted 6 years ago

I understand but to make the function fade this will not work, I've already tried it but thanks.

POSTED BY: Betty Boo

Mine was just a hint in a general direction. I leave it to you to fine-tune it.

POSTED BY: Gianluca Gorni
Posted 6 years ago

Gianluca, this is a color function on y, if you look closely at my second diagram you will see that the fade is the same along each curve, whereas this code fades in the direction of y evenly.

POSTED BY: Betty Boo

Have you tried ColorFunction and ColorFunctionScaling? For example

xi = 2; k0 = 9; Show[
 Table[sol = 
   NDSolve[{D[xtraj[t], 
       t] == (Sinh[
         xtraj[t] (t - xi)])/((Cos[xtraj[t]]) + (Cosh[
           xtraj[t] (t - xi)])), xtraj[0] == n}, 
    xtraj[t], {t, 0, 4}];
  ParametricPlot[{t, xtraj[t]} /. sol, {t, 0, 4}, PlotRange -> All, 
   ColorFunction -> 
    Function[{x, y}, Directive[Opacity[Abs[y]/4], Blue]], 
   ColorFunctionScaling -> False], {n, -4, 4 - 0.5, 0.5}]]
POSTED BY: Gianluca Gorni
Reply to this discussion
Community posts can be styled and formatted using the Markdown syntax.
Reply Preview
Attachments
Remove
or Discard

Group Abstract Group Abstract