Infra-red reflectance sensor arrays, widely used in line following robots, typically comprise of 5 to 8 sensors. However, for best performance, the sensors of the array must be calibrated properly according to the reflectivity of the specific surface so that the robot follows the line primarily using the central sensors. Using a larger number of reflectance samples for this is preferable for best results; the only issue here is that this is very time consuming when tuning the robot using a PD algorithm, often resulting in heating of the DC motors, particularly if the ambient temperatures are high. To avoid excessive heating, it is therefore important to attempt performing the calibration using lesser number of samples, provided it is possible to verify that the sensors have been tuned properly.
For creating fast robots, micro-metal gear motors with a 30:1 gearbox at 1000 rpm offer fantastic speeds, but are prone to heating due to their miniature size, even at lower speeds around 300 rpm, if powered for longer intervals of time. As mentioned, this process is accelerated by high ambient temperatures; in New Delhi, India, midday temperatures in June can hover around 45 degrees Celsius (about 113 degrees Fahrenheit)!
ROBOT CONSTRUCTION
In this project, a line following robot utilizing the Arduino Mega 2560 microprocessor was constructed which featured, primarily, the following hardware:
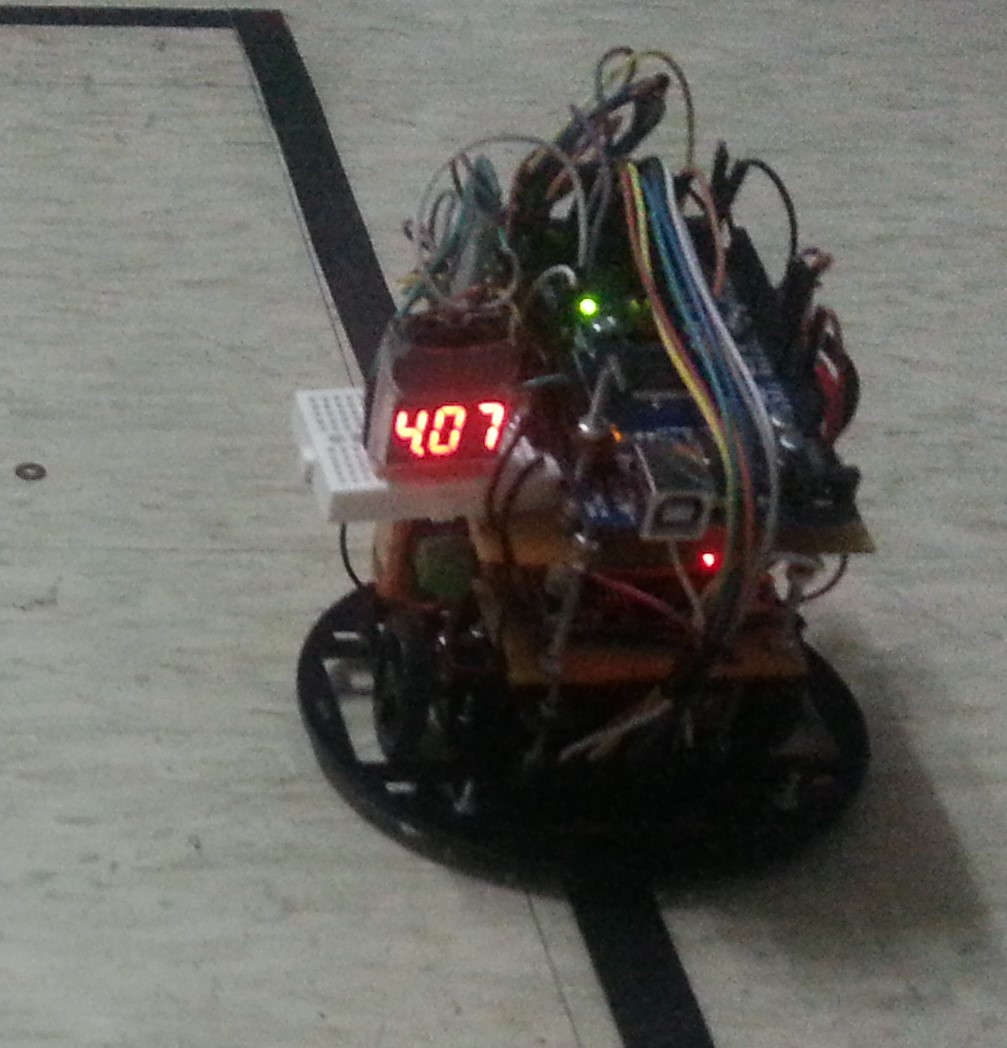
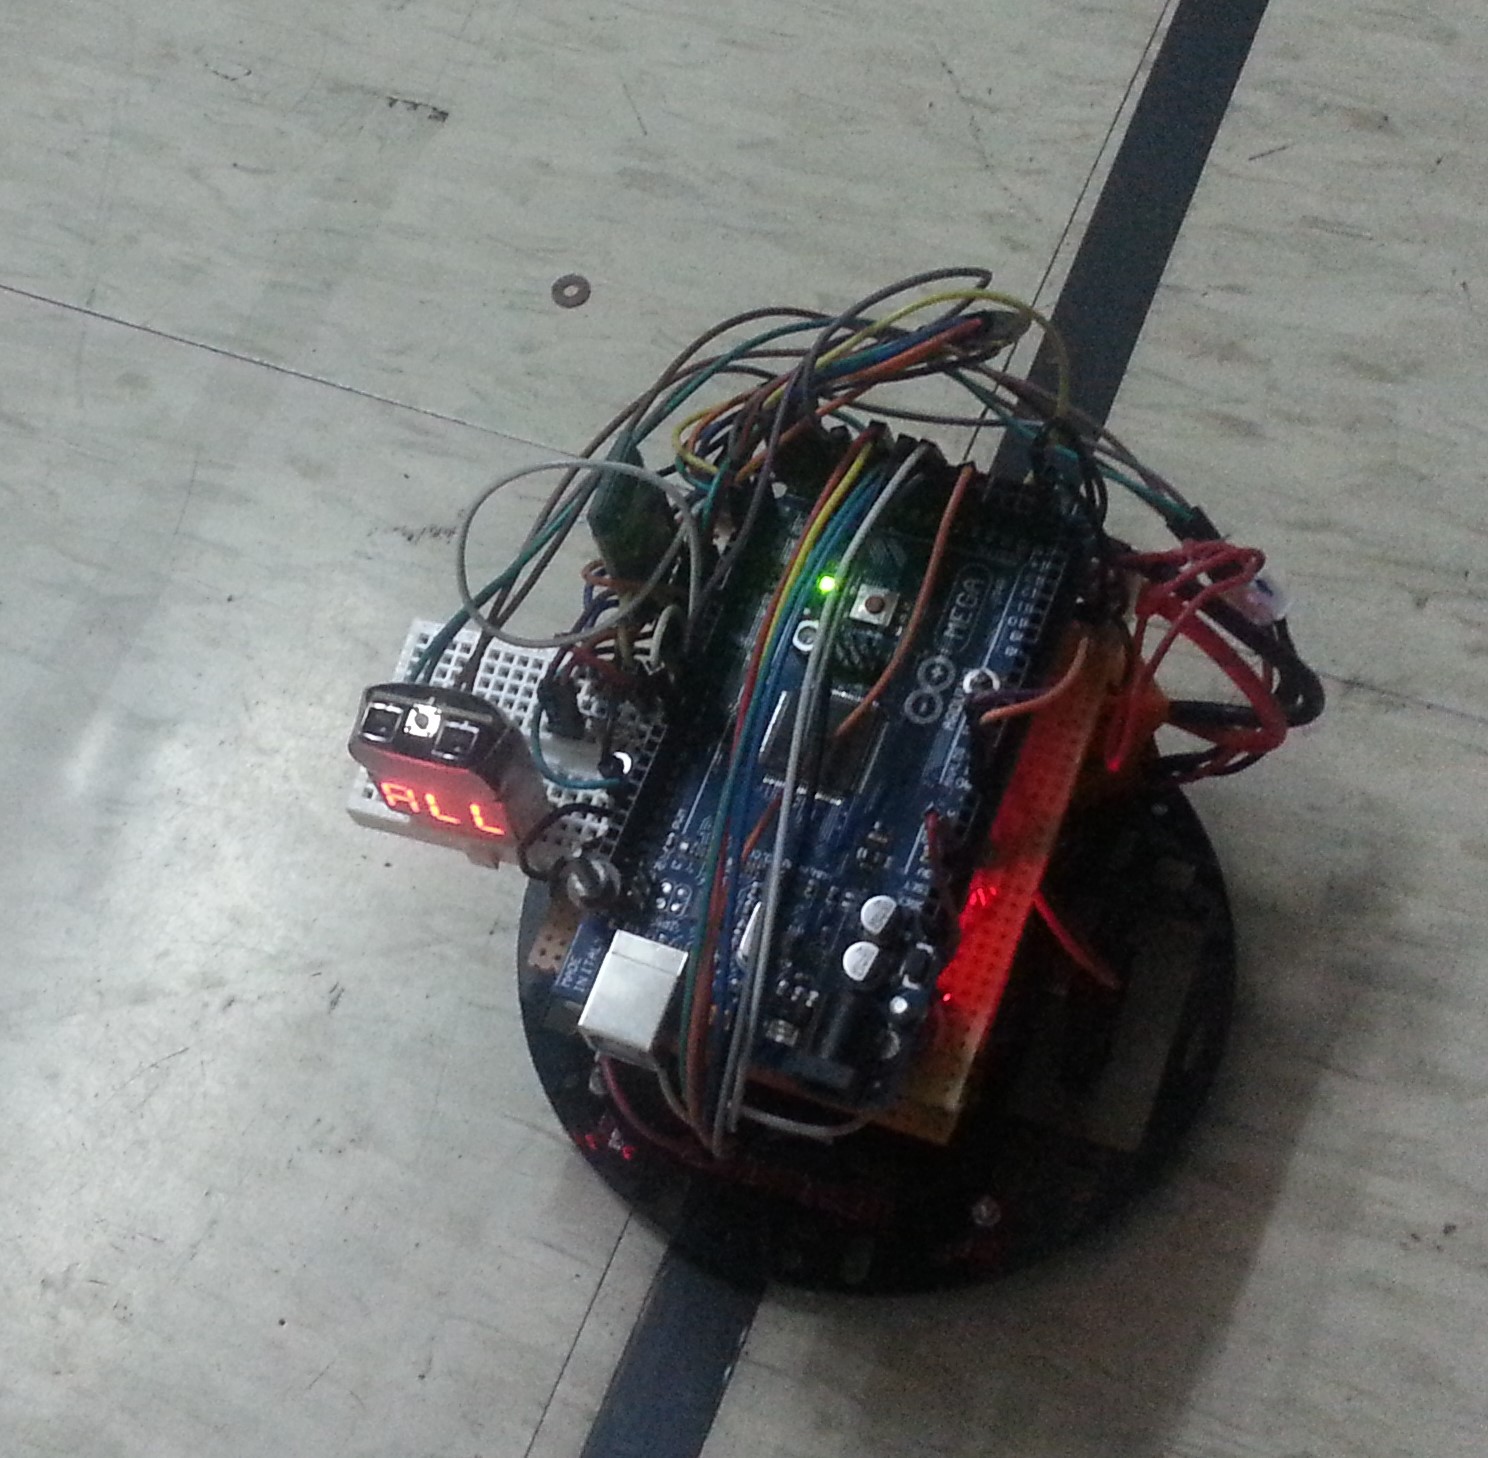
The temperature sensors were physically affixed to the casing of each motor, respectively, with their outputs connected to the Arduino analog pins.
Photographs of the robot appear below:
ROBOT OPERATION
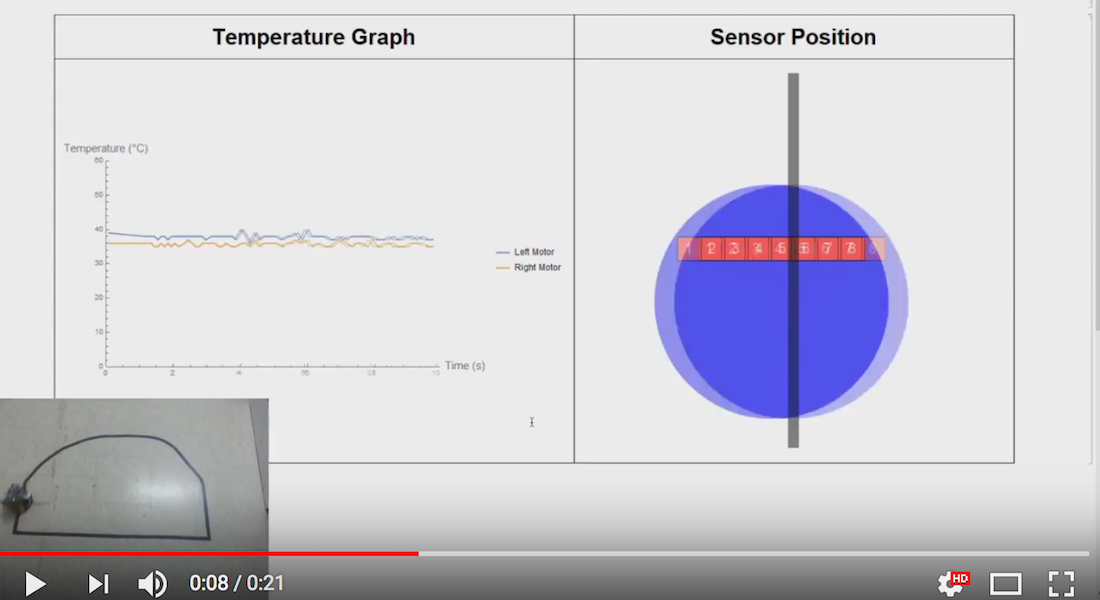
The temperature sensors needed to be calibrated according to the prevailing ambient temperature before starting the robot. The DC motors were controlled using the TB6612FNG module and the Lithium Polymer (LiPo) battery. The power supply to the Arduino board was provided via the LiPo battery and the LM2596 DC-DC buck converter Step-Down module to ensure constant 5V DC input. Finally, two-way communication between the robot and Mathematica was established using the HC 05 module i.e. to send commands to the robot and also receive sensor data from the QTR array and the temperature sensors, in real time, using a serial connection. The powerful and dynamic graphical capabilities of Wolfram Mathematica were utilized to create a real time graph of data from both the temperature sensors, and a dynamic graphic showing the specific sensor of the 8-sensor array positioned above the line.
The video of the setup is available here.
CODE
Following is a recursive definition for acquiring serial data. Recursion was, by far, the best method to ensure that data was received into Mathematica.
GetData[] := (Off[Last::nolast]; ard = DeviceOpen["Serial", "COM6"];
  in = Last@
    Flatten[ToExpression[
      StringSplit[
       StringCases[FromCharacterCode@DeviceReadBuffer[ard],
        "{" ~~ __ ~~ "}"], "\r\n"]], 1];
  If[Length[in] == 1,
   Clear[in];
   GetData[], Return@in])
RESULTS
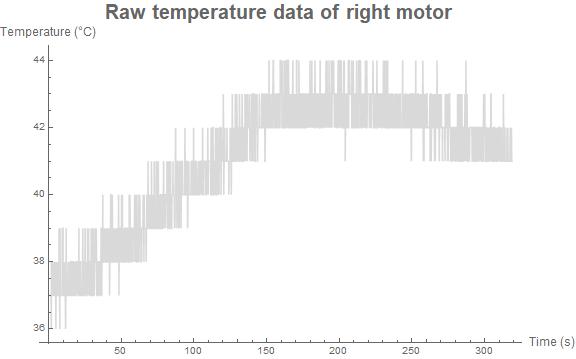
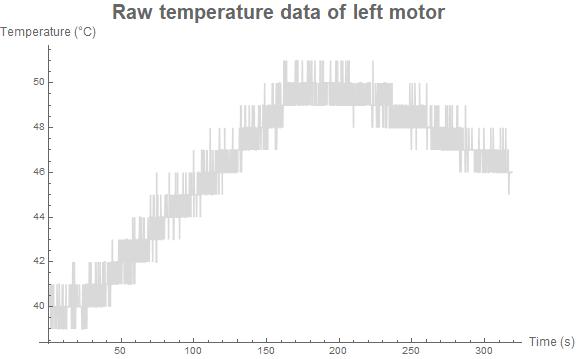
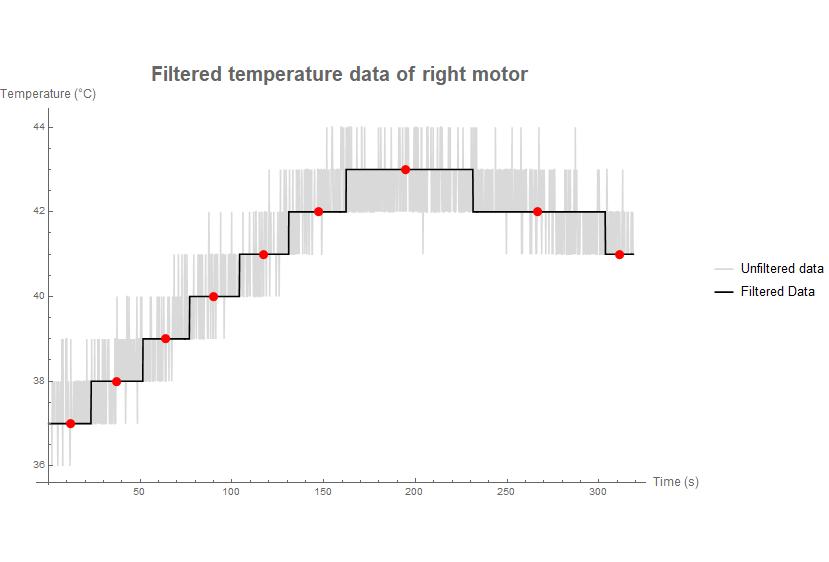
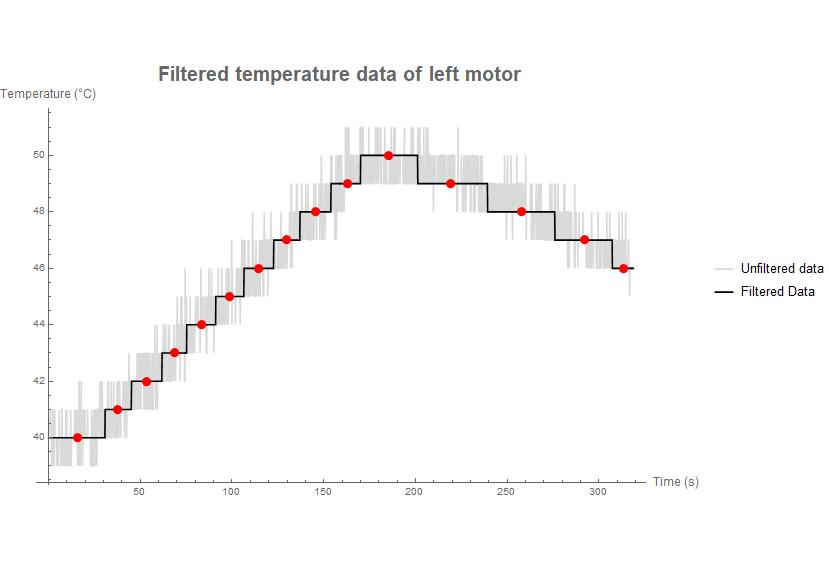
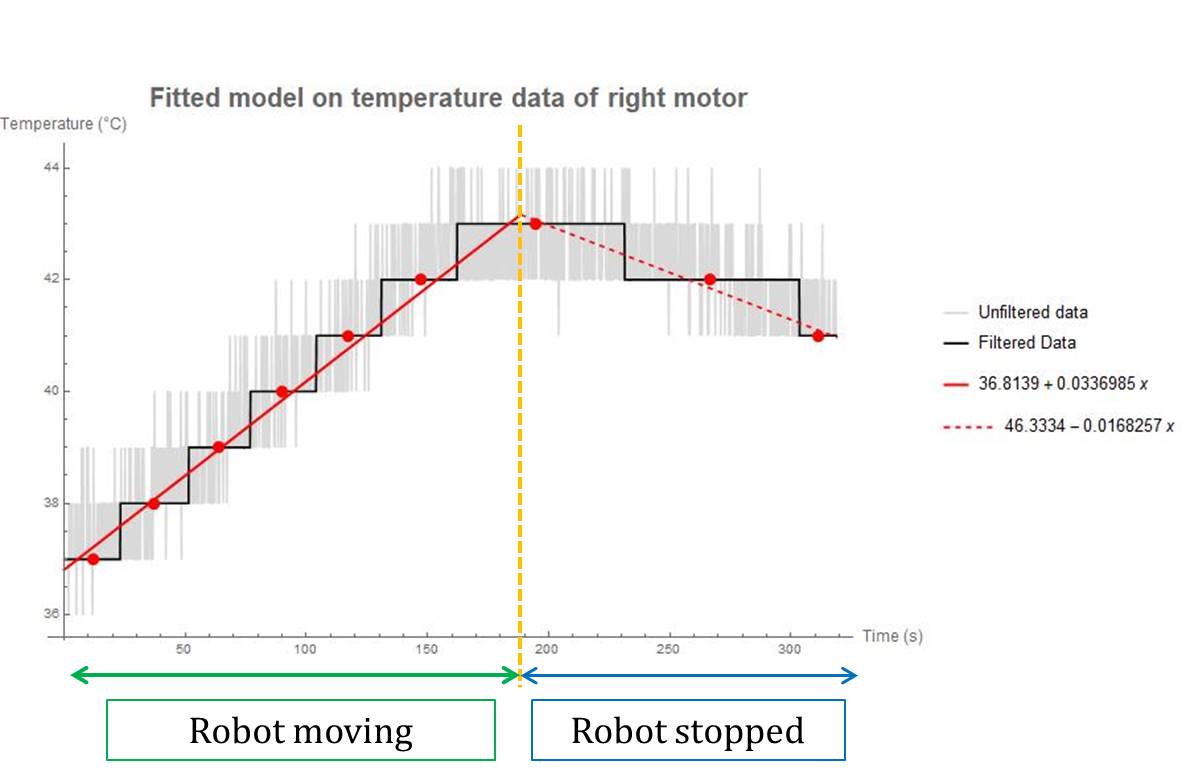
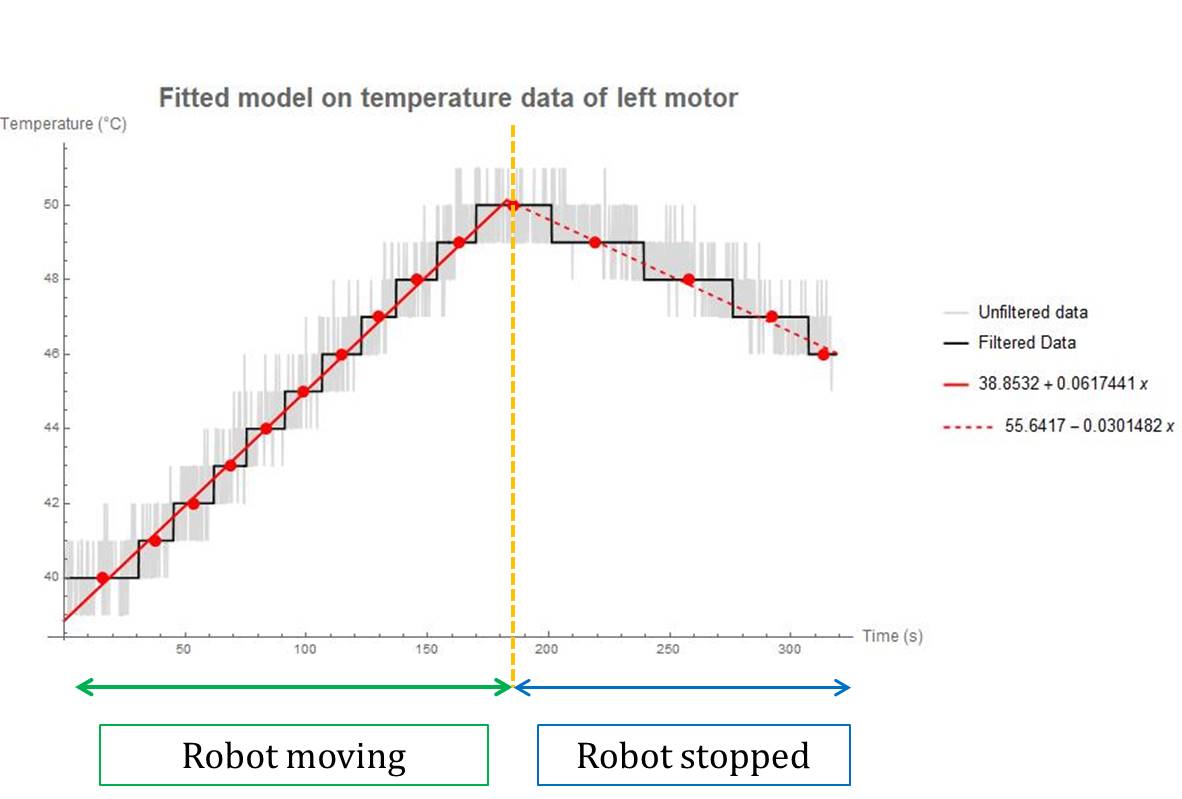
The MedianFilter function of Wolfram Mathematica was used to filter noisy raw data, and the Fit function was used for fitting a linear model to the data, for two segments:
- Robot in operation (temperature of both the motors increasing), and
- Robot halted (temperature of both the motors decreasing)
An algorithm was also written to determine the median temperatures attained by the motors, which are indicated by the red points on some graphs.
Since the left wheel of the robot traversed a longer distance due to the robot taking right turns, as seen in the video, it was observed that the left motor heated up more, and that too faster, in comparison to the right motor.
CONCLUSION
Wolfram Mathematica offers an excellent platform for real-time data acquisition and processing. This led to the following being achieved:
- Determination, through a dynamic graphic, of the exact sensor above the line being followed by the robot resulted in achieving faster implementation of the PD algorithm used in this project. This also helped in monitoring the movement of the robot in real time and verifying if the sensors of the array were calibrated properly while performing multiple runs continuously.
- Temperature monitoring of the motors in real-time. This was important as previously one had to stop the robot to check the temperatures of the motors manually, usually when burning smell became apparent!
- Extracting relevant data from noisy temperature data, and determining equations for the same. The filtering and fitting functions of Mathematica made the task simpler!


