Hi guys, new user here...trying to figure out what I'm missing here
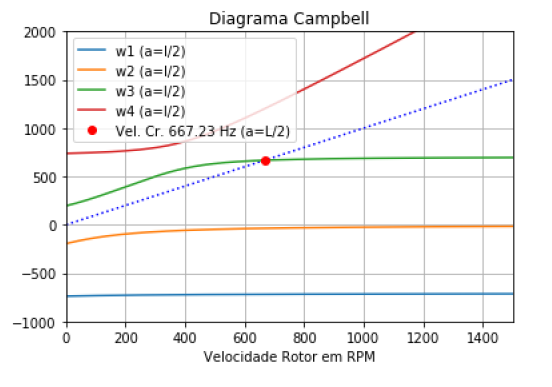
The idea is to get a graph similar to this one
m = 10;
Jp = 2;
Jt = 1.2;
l = 0.2;
k12 = 0;
ka = 2.5*(10^6);
k11 = 2*ka;
k22 = (0.5^2 + 0.5^2)*ka;
Eqt = \[Omega]^4 - \[Omega]^3*\[CapitalOmega]*(Jp/
      Jt) - \[Omega]^2 ((k11/m) + (k22/
        Jt)) + \[Omega]*\[CapitalOmega]*((k11*Jp)/(m*Jt)) + ((k11*
        k22 - k12^2)/(m*Jt)) == 0
Plot[Eqt, {\[Omega], -1000, 1500}, {\[CapitalOmega], 0, 1500}]
The Eqt term is the quartic equation and there is two variables ? and ? (abscissae). I could only plot3d it... any suggestions to plot like the graph above.
cheers,


