As this post's title promises, herein we will explore the application of neural networks with graphs
Background
Un-/directed graphs consist of vertices and edges/arcs (respectively). Graphs are an intuitive and true-to-form way to depict relationships between data. Although they may be easy for humans to draw, their unique form has lead to a plethora of graph data-types. Most commonly one will likely find a graph as an adjacency matrix (AM) or adjacency list (AL); the former is a $n\times n$ matrix with a $1$ at index $m_{i,j}$ if vertex $i$ has an edge with vertex $j$. The latter is a table where each row corresponds to a vertex, and the vertices that are placed in said row share an edge with the row's vertex. Below shows the same graph represented in several ways
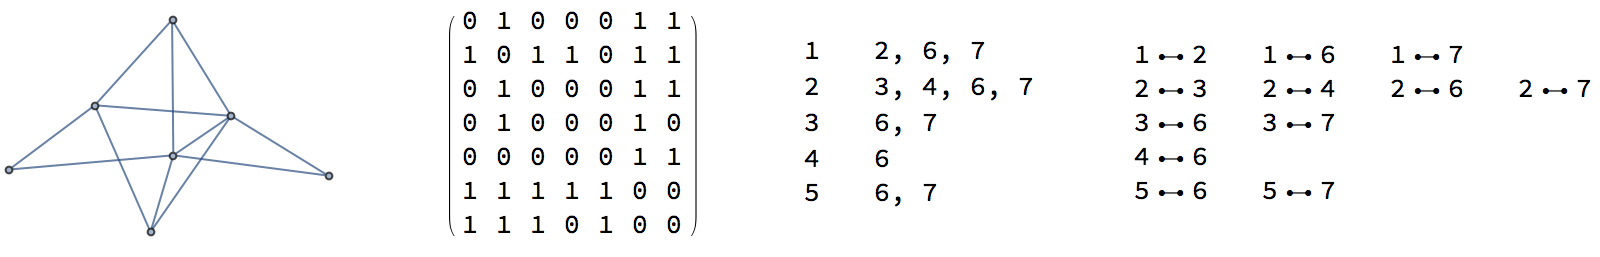
from left to right: graph drawing, adjacency matrix, adjacency list, edge list
The above image houses most of the key concepts for this post, but a few more are needed.
First is the concept of a simple graph. This means no multi-edges and no buckles (an edge from vertex $i$ to vertex $i$). See the corresponding Math World overview if this is still not clear. In the Wolfram Language, one can test if a Graph is simple via SimpleQ. In an adjacency matrix, multi-edges can not exist, so it is easy to tell if a graph is simple by just looking at the diagonal, where if a $1$ is present it means there is a buckle (and edge from vertex $i$ to $i$).
Second is a general explanation of Graph Drawing. Graph Drawing is the automated process of having a computer generate an image, "draw", of a given graph. There are many graph layouts - collections of algorithms which depict how the graph should be render - and many of them can be use via the GraphLayout option from a Graph in the Wolfram Language. Of particular interest, in this post, is a graph drawing style called hierarchical graph drawing ("LayeredEmbedding" as value for GraphLayout). For those uninitiated, it may seem like a trivial task to draw a layered graph, but it is by no means an easy feat. Most layered graphs follow the Sugiyama framework for hierarchical graph drawing. In brief:
- Convert input graph to a directed acyclic graph (DAG)
- Layer the DAG
- Ensure the layered DAG is properly layered (all edges span at most $1$ layer) via the inject of placeholder "dummy" vertices
- Edge crossing minimization
- Horizontal coordinate assignment
- Vertical coordinate assignment
- remove dummy vertices, add / un-reverse edges affected in step 1
- render graphics
this multi-step process consists of several sub-problems which are NP-hard as well loaded with heuristics.
Third is a concept called graph isomorphism, where the sam number of vertices are connected in the same way. If we fix our matrix size to be $n\times n$ then there can be several graph isomorphism for each graph of $m$ vertices $<n$. Often these graphs will be drawn the same way, although not all graph drawing algorithms are deterministic.
With these concepts in mind, we are ready to proceed.
Deep learning with graphs
Of all the ways we could represent a graph, perhaps the most readily adapted for use with a neural network is the adjacency matrix. However, as graphs grow in size (in regards to the number of vertices), the adjacency matrix (in general) will become more sparse. So learning on large graphs may still be an issue. On the other hand, for an adjacency matrix of $n\times n$ ( $\text{AM}_{n}$) there are $2^{n^2}$ possibles graphs, so we will have plenty of data to train on.
SimpleQ network
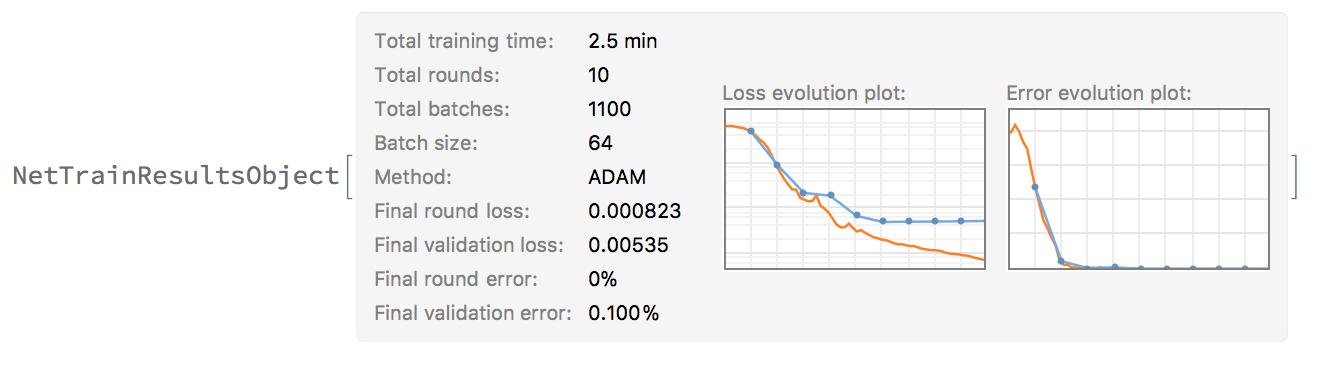
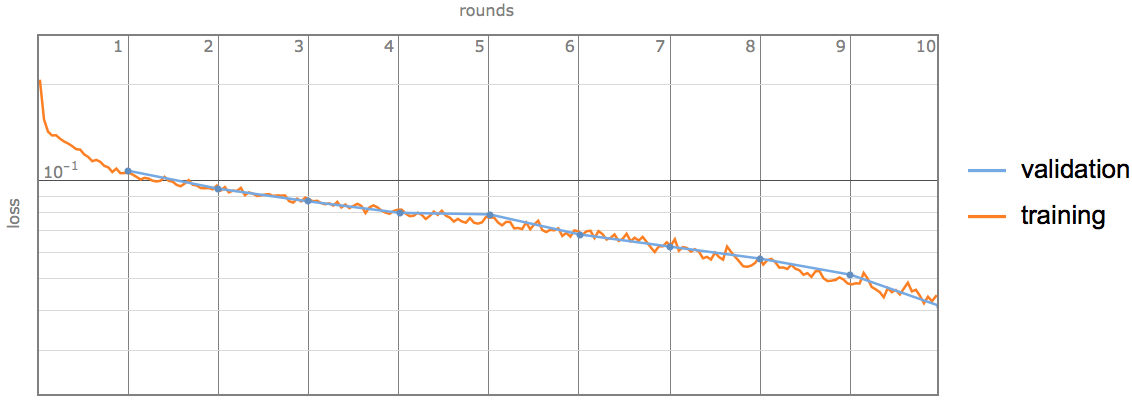
For a sanity check, we will train a neural network to learn whether or not a graph is simple from the adjacency matrix (i.e. if there is a $1$ on the diagonal). Using $\text{AM}_{200}$, and the following neural network (NN) where we partition our graph dataset into $70%$ training, $20%$ validation and $10%$ testing data, we get strong results:
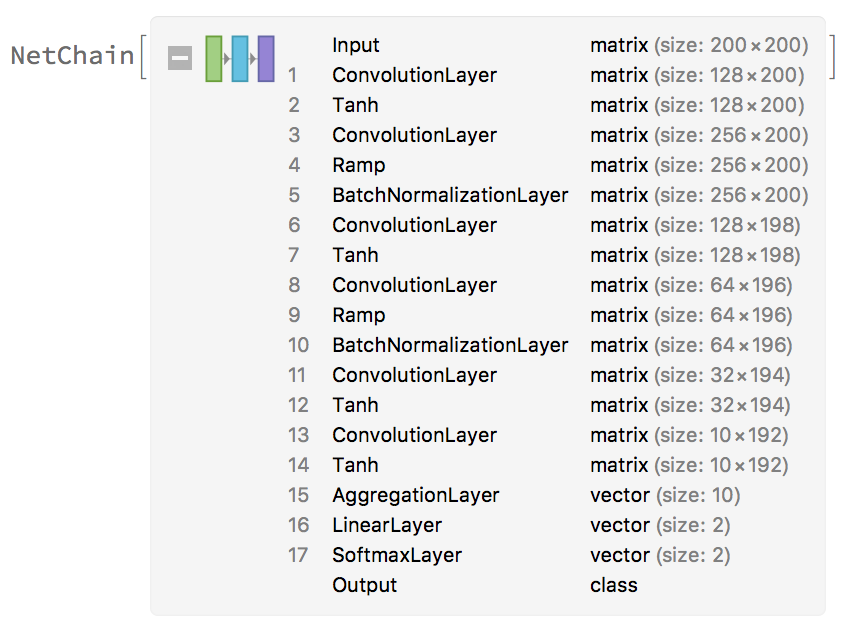
although we do start to overfit (as expected for such a trivial case)
Drawing
For graph drawing we will be using the coordinates provided after rendering a graph with GraphLayout->"LayeredEmbedding"
We could write a function containing the following code to get the coordinates of our vertices:
layout = SetProperty[graph, GraphLayout -> OptionValue["GraphLayout"]]
coordinates = GraphEmbedding[layout]
So lets make some data:
    n=5000000; (* number of graphs *)
    nov = 10; (* number of vertices *)
    poe = 0.5; (* probability of an edge *)
    glo = "LayeredEmbedding"; (* graph layering option *)
    ratios= {0.7, 0.2, .1}; (* ratio to split dataset into training, validation and test sets *)
    ds=MakeDataset[n,
        "NumberOfVertices"->nov,
        "ProbabilityOfEdge"->poe,
        "GraphLayout"->glo,
        "DiscretizeCoordinates"->Flase (* whether to use integer based values or not*)
    ];

    pd=PartitionData[ds, ratios];
    Export[FileNameJoin[{base,"data",
        "num_v_"<>ToString[nov]
        <>"_prob_e_"<>ToString[poe]
        <>"_layout_"<>glo
        <>"_n_"<>ToString[n]
        <>"_ratios_"<>ToString[ratios]
        <>".mx"
    }],pd];
Tossing our data into a simple network:
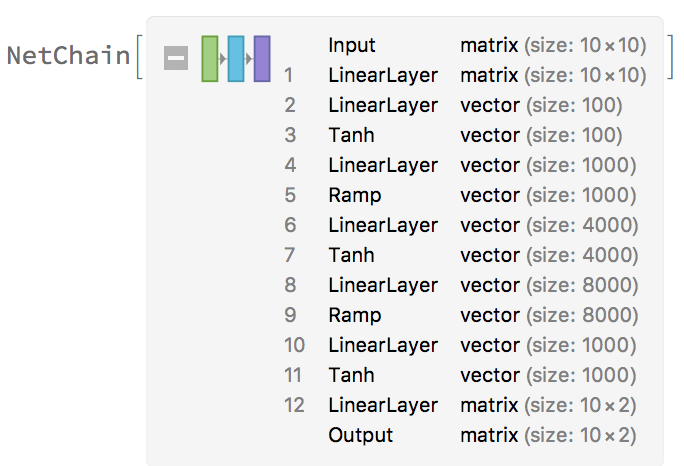
we are able to produce some very promising results:
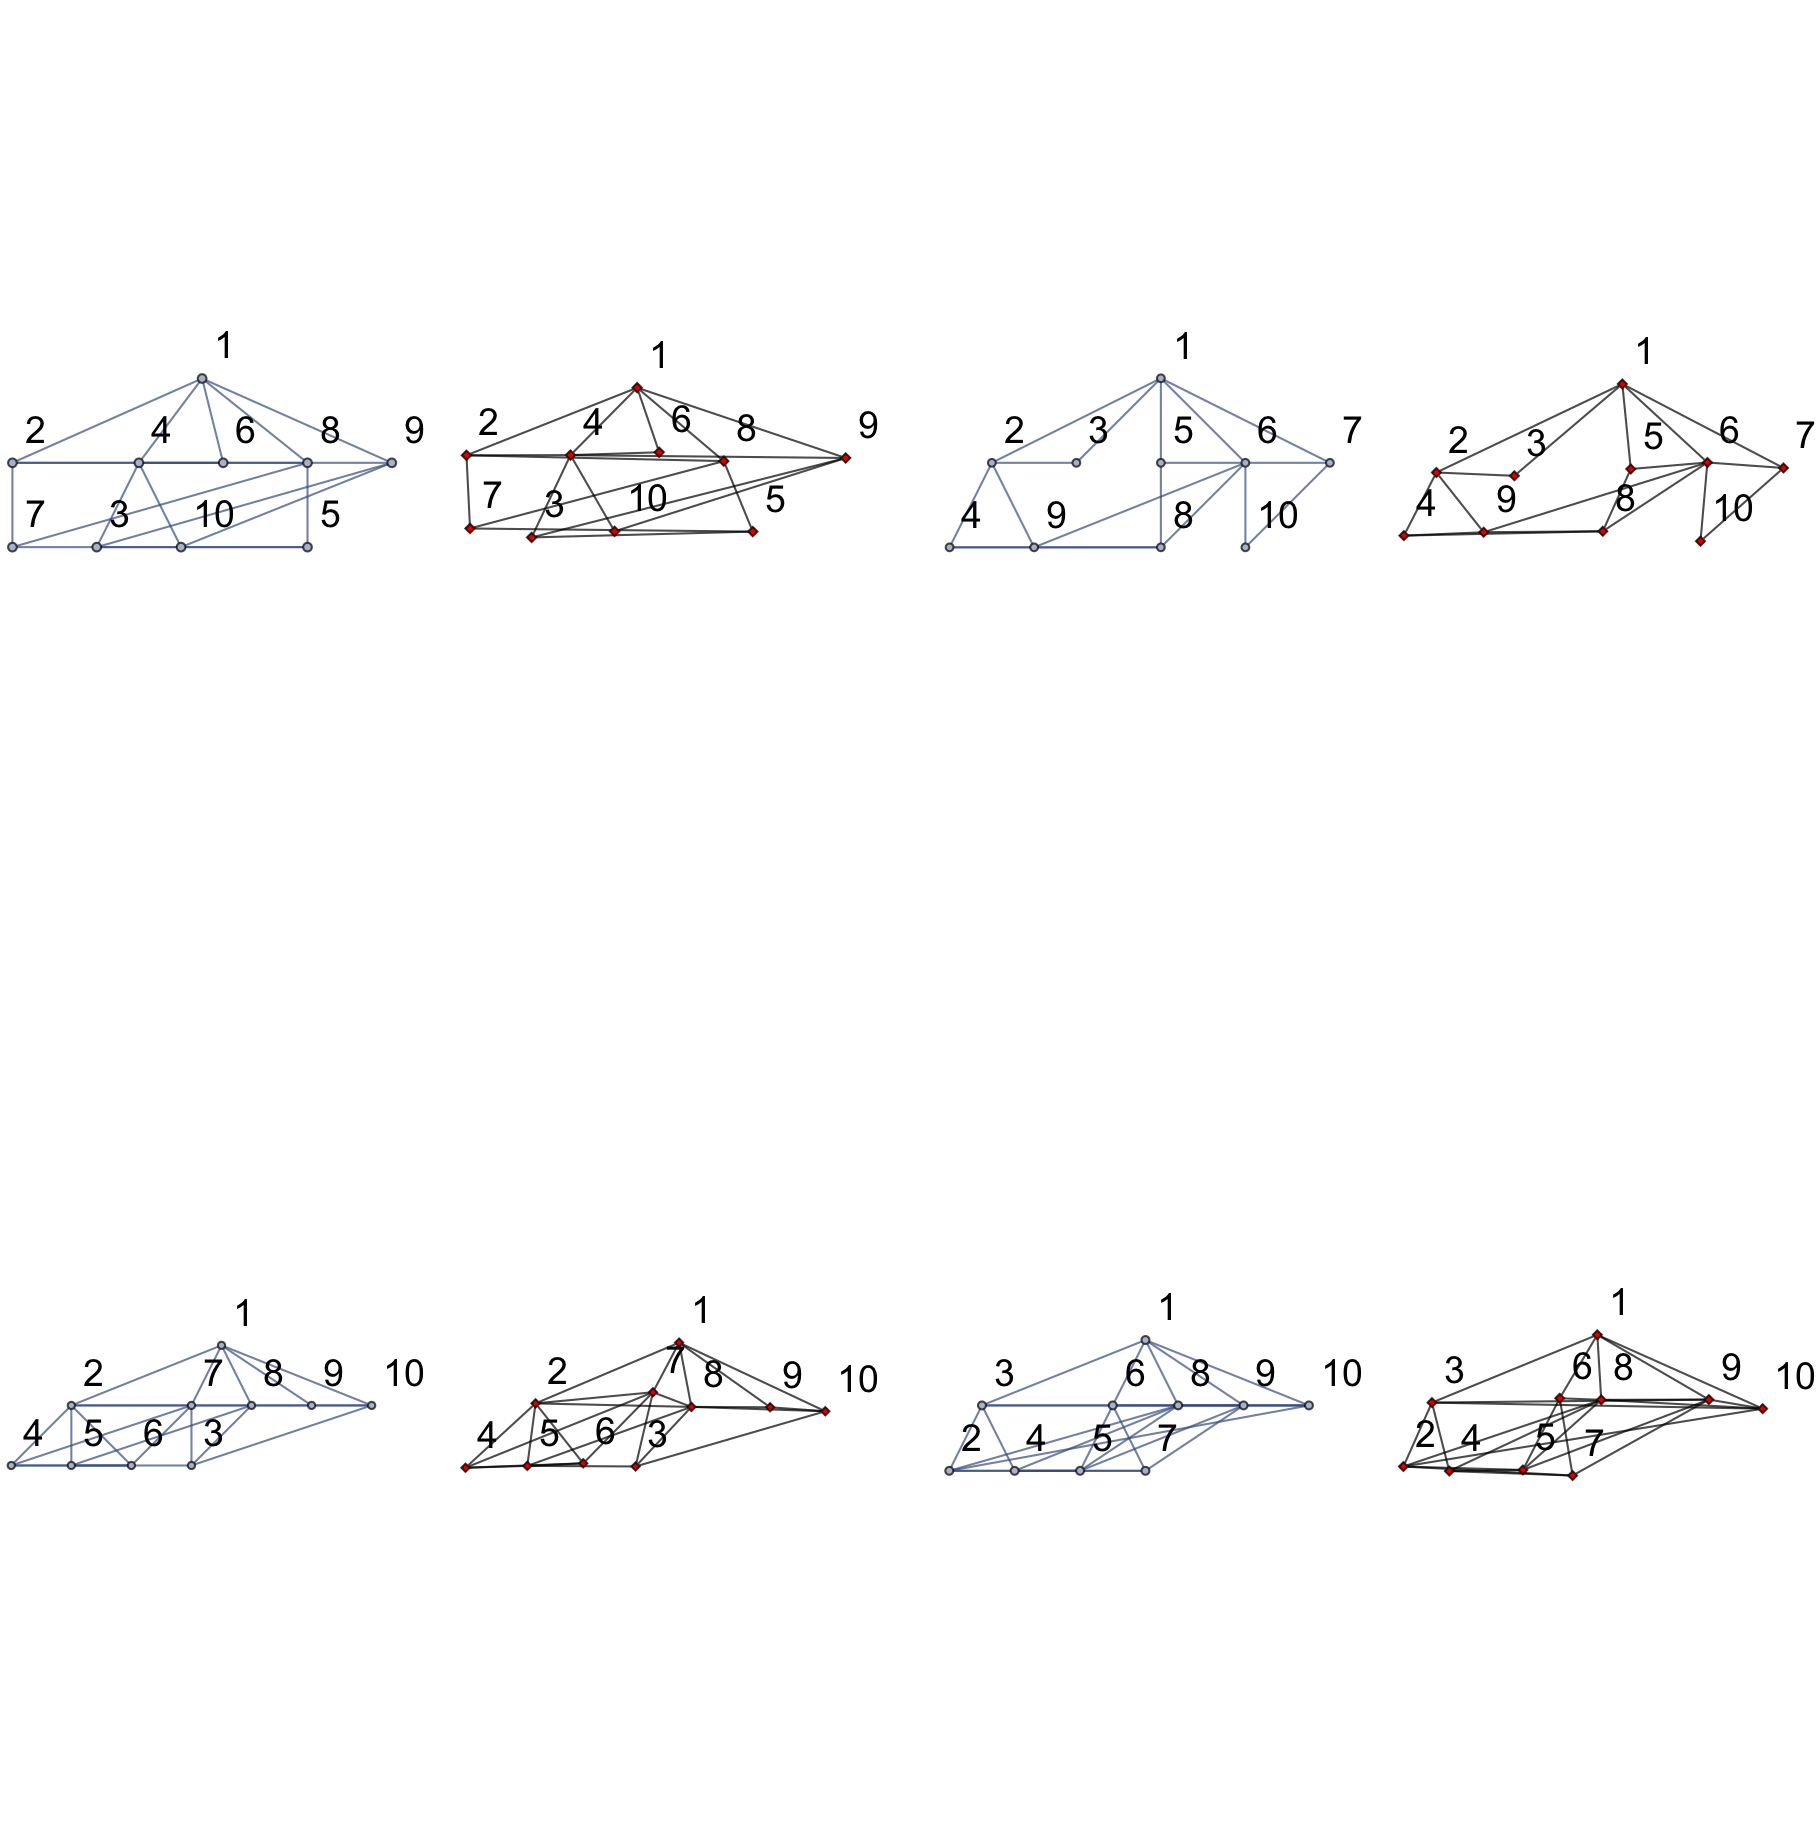
where the ground truth (Mathematica's rendering of the graph) is on the left in blue / gray and the predicted coordinates is on the right in black / red.
Since this layout algorithm is relatively indifferent to graph isomorphisms, it seems that this network "learned" implicitly not just how to handle isomorphisms, but steps 1 through 8 above. The ability to learn edge crossing minimization was somewhat unexpected with such a simple network, as it is a very intensive problem.
Now the graph drawings produced are not one-to-one with those produced with Mathematica. For one, they are not perfectly aligned - although close - perhaps using discretized coordinates would yield better results.
Second, while this was successful for LayeredEmbedding for SpringElectricalEmbedding the results are nowhere near as good (with the same network). Likewise, trying a convolutional neural network yielded worse results. This would be something I would like to follow up on, or possibly try conditioning the network to produce coordinates for a specified layout.
Lastly, I would like to try changing the architecture of this network drastically. For example, it is conceivable to encode each vertex as a character and then feed in walks as a sequence of vertex-characters to a RNN, or just the pairs of vertices which constitute an edge.
Summary
The main point of this post was to see if adjacency matrices were sufficient for learning from graphs. Given the arduous task of learning graph drawing, we see promising results, but much more exploration is left to be done. The results here suggest that learning attributes related to graph isomorphic graphs should be possible. Given the number of NP-hard algorithms required to produce a layered graph, for a sufficiently large graph, perhaps a NN approach may be faster to render a drawing.
 Attachments:


