Learning statistics and data analysis from a textbook is challenging, especially for younger learners. As part of the Education Innovation track at the Wolfram Summer School, I created a module for the Computational Thinking Initiative for middle school students to learn survey skills, statistics, and data visualisation through experimentation and exploration.
Creating a Survey
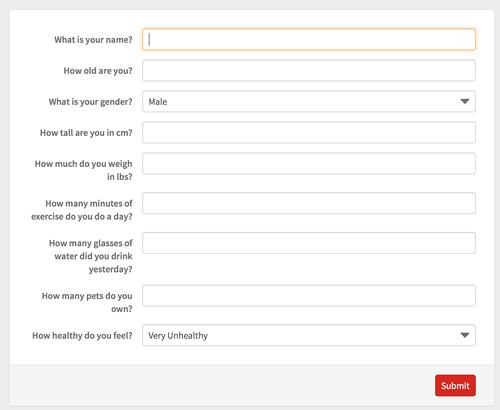
The students' journey through this module begins with designing and deploying a survey. In Wolfram, this is a relatively easy task:
CloudDeploy[
 FormFunction[{
   {"name", "What is your name?"} -> "String",
   {"age", "How old are you?"} -> "Number",
   {"gender", "What is your gender?"} -> {"Male", "Female", "Other"},
   {"height", "How tall are you in cm?" } -> "Number",
   {"weight", "How much do you weigh in lbs?" } -> "Number",
   {"exercise", "How many minutes of exercise do you do a day?"} ->
    "Number",
   {"water", "How many glasses of water did you drink yesterday?"} ->
    "Number", {"pets", "How many pets do you own?"} -> "Number",
   {"health", "How healthy do you feel?"} -> {"Very Unhealthy",
     "Unhealthy", "Healthy", "Very Healthy"}
   },
  DatabinAdd[
    bin, <|"name" -> #name , "age" -> #age, "gender" -> #gender,
     "height" -> #height, "weight" -> #weight,
     "exercise" -> #exercise, "water" -> #water, "pets" -> #pets,
     "health" -> #health|>] &],
 Permissions -> "Public"]
This is very easy for students to read. The code is very natural: I want to cloud deploy a form which asks these questions and records them with these headers, in these formats, in my data bin. That's exactly the order in which the code operates.
Students are encouraged to look at the code in order to recognise the pattern for creating a question, and then create some of their own. Maybe they'd like to go to the Wolfram documentation and work out how to add a question with Radio Buttons or a Slider?
The teaching resources for each section include lots of socratic questions. Socratic teaching involves posing open questions to students and asking them to come up with the answers for themselves. What kinds of questions could we ask in a survey? What kinds of answers could we get? Students should take time to brainstorm answers to these questions, both before and after they do the tasks. This enhances their ability to think broadly and computationally, and creates a firm base for further exploration.
Students then deploy their surveys on the cloud, share theirs with their peers, and gather answers to analyse.
Once students have gathered their data, they can start to explore and analyse it.
Visualising Data
The bulk of my project at Wolfram Summer School has been creating a function which takes data and returns an interactive series of graphs. You can find the code here. Students can select which data they want to look at, and how they want the data displayed, and the function simply gives them that graph in 1 or 2 clicks.This animation shows all the options for creating graphs for a sample data set.
A cool thing about this is that the students are presented with several graphs which are useful, and several which are not. For example, they can see that a Pie Chart is not a useful way of visualising the ages of their respondents.
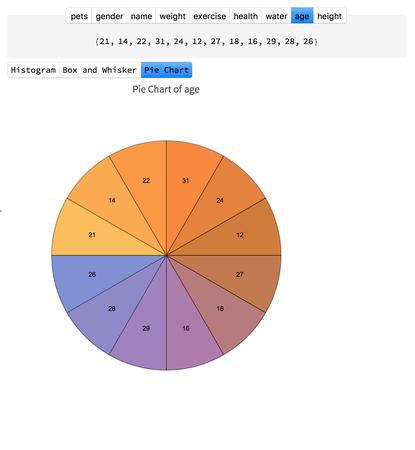
This ability to see different types of visualisation at a glance allows students to build a model in their head of what data will be represented best on what types of chart. Students can also start addressing the question of why we create data visualizations rather than just looking at the data in a table. What do different types of visualisations add to our interpretation of the data?
What can we find out about our data?
Alongside the graphs, my function also generates some simple descriptive statistics for students' data. We calculate the Mean, Median, Mode, Range, and Interquartile Range. Hovering over each number gives us a brief description of what that particular statistic means. This is a good opportunity for the teacher to go over how descriptive statistics work, and for the student to see them in action, with data they've collected themselves.
Students are encouraged to come up with a couple of hypotheses about their data, and then gather evidence for or against their hypotheses.They can copy the graphs and descriptive statistics as relevant in order to write a short evidence paragraph.
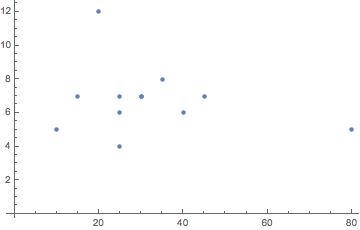
Often, students will come up with hypotheses outside the current scope of my function. Perhaps they're interested in seeing if the number of glasses of water their peers drink in a day is correlated with the minutes of exercise they do. While this will eventually be incorporated into the function, at the moment it's a cool opportunity to learn more about correlation, and write more simple Wolfram code. Drawing a scatter graph between two data sets in Wolfram is simple. Here we're using the data from the questions about Minutes of Exercise and Glasses of Water drunk.
ListPlot[Transpose[{{30, 10, 25, 40, 80, 30, 25, 35, 20, 15, 25, 45}, {7, 5, 4, 6, 5, 7, 6, 8, 12, 7, 7, 7}}]]
Throughout this module, students are asking big questions about the nature of data visualisation. Why do some charts explain/describe the data better than others? Why do we use data visualizations instead of just showing the data? What do descriptive statistics show us about the data? They're also learning about different forms of statistics, and learning how to think like a computer enough to give simple commands in the Wolfram Language.
There's a lot of scope for expansion in this project. I'd like to integrate options for correlation, comparing multiple sets of data on the same charts, and more complex descriptive statistics.
Computational Explorations are a great way to help students learn about important math and science topics while developing their computational, critical and creative thinking skills. Analysing their own data in this project gives a sense of agency and ownership over their project that answering questions from a book couldn't give.
I plan to work with middle school teachers in order to get this project trailed in schools, and make improvements and changes based on their feedback. Improving and developing this project will hopefully form the bulk of my undergraduate dissertation.
I very much enjoyed working on this project at the Wolfram Summer School, and I'm looking forward to extending it in the coming months.
 Attachments:


