According to the World Health Organization(WHO), more than a quarter billion people today are living with Hepatitis B virus (HBV) and about 890,000 die every year as a result. As such, viruses are responsible for a variety of illnesses, ranging from common cold to some type of cancer and more serious conditions such as AIDS. Although the symptoms of infections might be different, the methods of infection are quite similar. The virus enters the cell, typically through the interaction with a receptor on the cell surface; it must then disassemble its capsid to release the genetic material. The viral genome is then replicated and the proteins are synthesized; new viruses can then assemble, and exit the cell either through the membrane or when the cell dies.
With the capsid, the viral protein shell, viruses conceal their genetic material and can slip inside the host's body (like a Trojan horse!). The goal of my project was to create an applicable structural model of the proteins that compose the capsid to better understand the viral life cycle and infection mechanism.
First, import data from protein database(PDB):
data =Import[URLDownload["https://files.rcsb.org/download/3J3I.pdb1.gz"],"String"];
Since the data arrangement is irregular, replace negative signs(-) with spaces to better align and separate columns:
spaced = StringReplace[data,"-"-> " -"]
Read data starting from row 180 where atomic information starts:
Do[Read[str,"String"],181];
Read[str,"String"]
Split the list when consecutive first letter appears to separate between subunits:
splitted = Split[fullrecord,First[#1]===First[#2]&];
Remove unnecessary rows(only take ATOM data):
removed = DeleteCases[splitted,x_/;First[First[x]]== "TER"];
removed = DeleteCases[removed,x_/;First[First[x]]== "HETATM"];
removed = DeleteCases[removed,x_/;First[First[x]]== "MODEL"];
removed = DeleteCases[removed,x_/;First[First[x]]== "ENDMDL"];
removed = DeleteCases[removed,x_/;First[First[x]]== "MASTER"];
removed = DeleteCases[removed,x_/;First[First[x]]== "END"];
Now check dimensions of the data, the dimension should equal 60 times the T number of the virus structure that is used. For example, 3J3I virus that is used in this code as an example is T = 3, therefore the dimensions should equal 180. This is because of the 60 fold symmetry of icosahedral viruses.
Dimensions[removed]
Now with the data polished, we need to extract specific coordinates and chain types:
xcoor =  ToExpression[removed[[All,All, 7]]]
ycoor =  ToExpression[removed[[All,All, 8]]]
zcoor =  ToExpression[removed[[All,All, 9]]]
atom =   removed[[All,All, -1]];
To calculate center of mass, we need to replace chain types with corresponding atomic mass:
atomicmasses =
 Association@
  Thread[{"N", "C", "O", "S"} ->
    Through@{Entity["Element", "Nitrogen"],
       Entity["Element", "Carbon"], Entity["Element", "Oxygen"],
       Entity["Element", "Sulfur"]}[
      EntityProperty["Element", "AtomicMass"]]]
Now we can calculate center of mass:
CoM[mass_, pos_] := mass.pos/Total[mass]
Put all x, y, z center of mass coordinates together for convenience:
totcentercoor[xset_,yset_,zset_] :=List[xset, yset, zset]
centercoor = MapThread[totcentercoor, {xset, yset, zset}];

totcoor[x_,y_,z_] :=List[x, y, z]
allcoor = MapThread[totcoor, {x, y, z}];
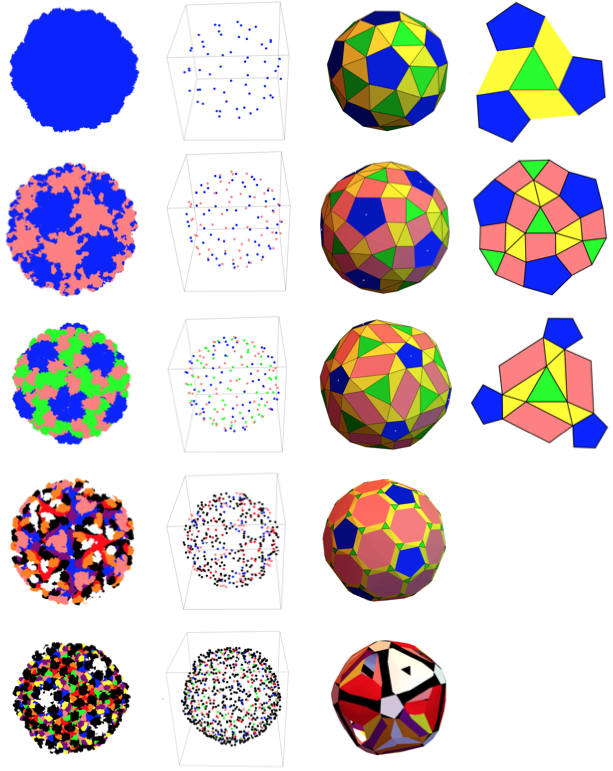
With all coordinate and chain type data, create a 3D point cloud with all protein units. For better analysis, chain types are matched with different colors.
colorlist = ToExpression[flatchain/.{"A"-> "Blue", "B" -> "Pink", "C" -> "Green", "D" -> "Red"}];
Graphics3D[{Point[allcoor,VertexColors->colorlist]}, Lighting->Automatic, Boxed->False]
And we get a cool image of the entire capsid structure! (This proves my point that all good science is art - look how beautiful the capsid structure is!)
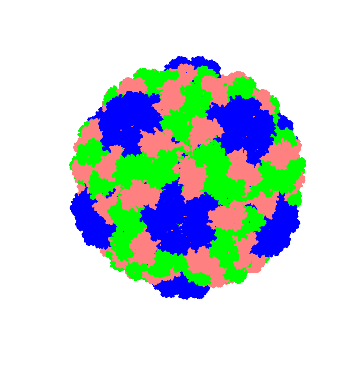
Let's also generate a point cloud with center of mass and see how it looks:
Graphics3D[{PointSize[0.02],Point[centercoor,VertexColors->colorlist2]}]
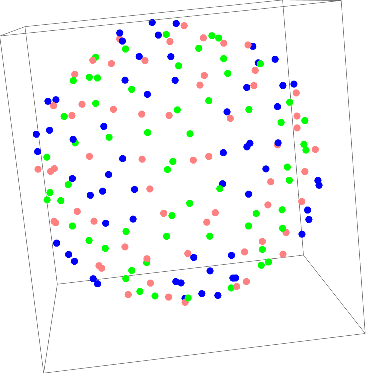
We now see how the center of mass is distributed and look at each subunits. Just to make sure we're doing everything right, create a surface mesh to see the general structure:
ListSurfacePlot3D[centercoor, BoxRatios->{1, 1, 1}]
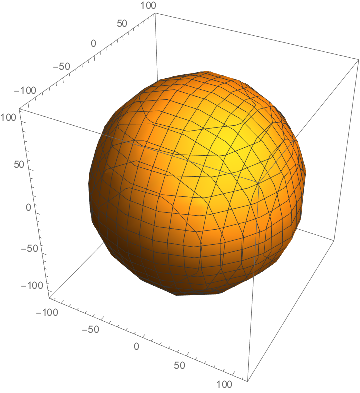
Now comes the fun part, we can start tiling on the structure! To create an edge-to-edge tiling on a spherical surface, we are going to use Penrose tiling, an example of non-periodic tiling generated by an aperiodic set of prototiles. Because Penrose tiling is non-periodic, there is no translational symmetry. However it is self similar, which means the same patterns occur at larger and larger scales. Thus, the tiling can be obtained through "inflation" (or "deflation") and every finite patch from the tiling occurs infinitely many times. Such tiling method perfectly matches our purpose of modeling viral capsids because Penrose tiling can be constructed to exhibit both reflection symmetry and fivefold rotational symmetry.
We start with creating a Delaunay mesh on the structure with all center of mass points as vertices of triangles. Delaunay triangulations maximize the minimum angle of all the angles of the triangles in the triangulation, thus avoiding silver triangles, triangles with one or two extremely acute angles. Thankfully, Mathematica has a built-in function for creating Delaunay mesh making our job a lot easier.
cm =RegionBoundary@DelaunayMesh@centercoor
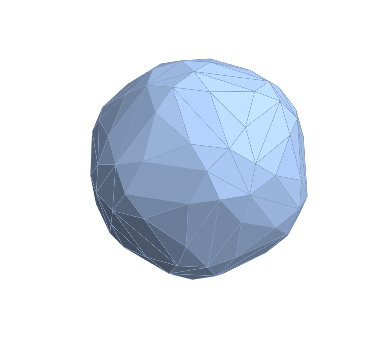
However, the mesh only creates sets of triangles. To get a uniform tiling, we need to figure out which triangles are most likely to form a subunit with another. Another problem arises with this method because not all triangles are on the same plane, making it harder to classify the triangles. To solve this problem, we are going to use some linear algebra and calculate the normal vectors of each triangles. All triangles with relatively similar normal vectors will be classified together and grouped on the same plane. normal
delaunaymesh = DelaunayMesh@centercoor;
trianglecomponents = MeshPrimitives[RegionBoundary@delaunaymesh,2];

normals=normal/@trianglecomponents;

rounded = Round[normals,0.1];
tally = Tally[rounded];

pent = GatherBy[tally,Last][[2]];
quad =  GatherBy[tally,Last][[3]];
tri =  GatherBy[tally,Last][[1]];

pentcoor = First /@ pent;
quadcoor = First /@ quad;
tricoor = First /@ tri;

value1 = Flatten /@ Map[Position[ rounded, #]&, pentcoor];
value2 = Flatten /@ Map[Position[ rounded, #]&, quadcoor];
value3 = Flatten /@ Map[Position[ rounded, #]&, tricoor];

coors1 = Map[Part[trianglecomponents,#] &, value1];
coors2 = Map[Part[trianglecomponents,#] &, value2];
coors3 = Map[Part[trianglecomponents,#] &, value3];

flat = Flatten[Map[ReplaceAll[Polygon->List][#] &, coors3],2];
subset = Map[Subsets[#, {2}]&,flat];
Since we want to look at the three-fold symmetry of the capsid structure, we are going to extract equilateral triangles(each side represents a rotational axis- therefore an equilateral triangle will be the center of three-fold rotational axis).
distance = Round[Apply[EuclideanDistance, subset, {2}],0.1];
equilateral[{x_,y_,z_}]:=(If[x==y==z,Return[1]])

positions = Flatten[ Position[equilateral /@ distance,1],1];

center = Map[Part[coors3,#] &, positions];
Although we grouped the triangles together, graphing them again requires a bit more work since the order of coordinates matter a lot when graphing the polygons. To do this, we will calculate the shortest tour around all vertices and re-orient them in order.
extracted[{Polygon[{r1_, r2_, r3_}], Polygon[{t1_, t2_, t3_}],
   Polygon[{y1_, y2_, y3_}]}] :=
 List[{r1, r2, r3, t1, t2, t3, y1, y2, y3}]
pentcoorext = DeleteDuplicates /@ Flatten[extracted /@ coors1, 1];
path1 = Last /@ FindShortestTour /@ pentcoorext;
pentfinal =  Map[Take[#, 5] &, MapThread[Part, {pentcoorext, path1}]];

extracted2[{Polygon[{r1_, r2_, r3_}], Polygon[{t1_, t2_, t3_}]}] :=
 List[{r1, r2, r3, t1, t2, t3}]
quadextract = DeleteDuplicates /@ Flatten[extracted2 /@ coors2, 1];
path2 = Last /@ FindShortestTour /@ quadextract;
quadfinal =  Map[Take[#, 4] &, MapThread[Part, {quadextract, path2}]];

extracted3[{Polygon[{r1_, r2_, r3_}]}] := List[{r1, r2, r3}]
triextract = DeleteDuplicates /@ Flatten[extracted3 /@ coors3, 1];
path3 = Last /@ FindShortestTour /@ triextract;
trifinal =  Map[Take[#, 3] &, MapThread[Part, {triextract, path3}]];
Now we can create a 3D Penrose tiling on a spherical surface(icosahedral to be specific, but it can be inflated to a sphere)! This is the complete model of simplified subunit structure of the capsid.
graphed =
 Graphics3D[{White, Point[Mean /@ pentcoorext], Blue, EdgeForm[],
   coors1, Pink, EdgeForm[], coors2, Yellow,
   EdgeForm[{Thick, Black}], coors3, Green, EdgeForm[], center},
  Lighting -> Automatic, Boxed -> False]
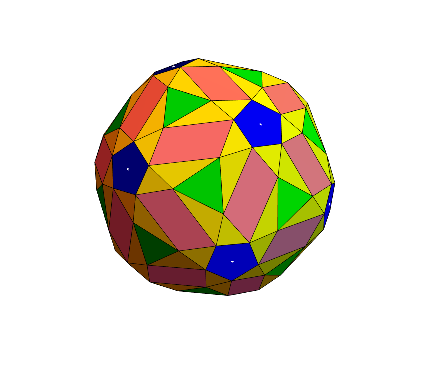
But we are not done here yet. To better analyze the structural symmetry, we want to look at the repeated pattern (there would be 20 occurrences of the unit pattern since icosahedral viruses exhibit the identities of icosahedral group) on a flat surface(2D). To do this, we need to flatten all tiles relative to a specific center. We orthogonalize the tiles and find orthogonal vectors relative to the central equilateral triangle we previously extracted.
projector[projectingPoint_] := Module[{a, b, c, d, nv, k},
    {a, b, c} = Flatten[center[[9]] /. Polygon -> List, 2];
    nv = Cross[b - a, c - a];
    d = -nv.a;
    k = (-d - nv.projectingPoint)/Norm[nv]^2;
    projectingPoint + k*nv
    ] &;
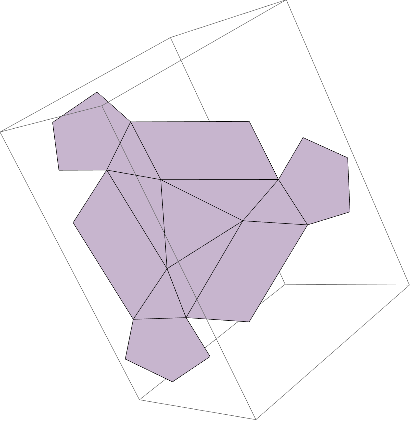
With the vectors calculated, we get a flattened structure of the unit pattern, all aligned on one plane:
object =
     Graphics3D[{
       Polygon /@ Map[projector, Part[pentfinal, {1, 2, 3}], {2}],
       center[[9]],
       Polygon /@ Map[projector, Part[quadfinal, {1, 2, 8}], {2}],
       Polygon /@
        Map[projector, Part[trifinal, {12, 4, 3, 45, 64, 69}], {2}],
        Boxed -> False
       }]

Planarize[x_, {u_, v_, w_}] :=
 x.Inverse[Orthogonalize[{v - u, w - u, Cross[v - u, w - u]}]]

pentproj = Map[projector, Part[pentfinal, {1, 2, 3}], {2}];
triproj = center[[9, 1, 1]];
quadproj = Map[projector, Part[quadfinal, {1, 2, 8}], {2}];
backproj =
  Map[projector, Part[trifinal, {12, 4, 3, 45, 64, 69}], {2}];

pentextcoors = Map[Planarize[#, center[[9, 1, 1]]] &, pentproj ];
triextcoors = Map[Planarize[#, center[[9, 1, 1]]] &, triproj ];
quadextcoors = Map[Planarize[#, center[[9, 1, 1]]] &, quadproj ];
backextcoors = Map[Planarize[#, center[[9, 1, 1]]] &, backproj ];
We now see a flattened structure of the unit pattern, with each subunit classified:
One last step to go, we just need to drop the z axis since all coordinates are aligned to put the structure onto a 2D surface.
map[x_] := Map[Drop[#, -1] &, x]

pentflat = Polygon /@ map /@ pentextcoors;
triflat = Polygon@Map[Drop[#, -1] &, triextcoors];
quadflat = Polygon /@ map /@ quadextcoors;
backflat = Polygon /@ map /@ backextcoors;

Graphics[{Tooltip[ {EdgeForm[{Thick, Black}], Blue, pentflat},
ImageResize[Import[pentimg], {150}]],
Tooltip[{EdgeForm[{Thick, Black}], Green, triflat}, "ChainB"],
Tooltip[ {EdgeForm[{Thick, Black}], Pink, quadflat}, "ChainB"],
Tooltip[ {EdgeForm[{Thick, Black}], Yellow, backflat}, "ChainA"]}]
We can now clearly see the unit pattern on a 2D space! Since the pentagons always are on the vertices of the bigger triangle that contain the unit pattern, our structure exhibits all 2,3,5-fold symmetry.
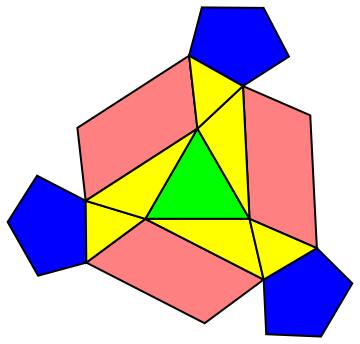
As such, we have analyzed the structural pattern of subunits of viral capsids. The closeness of the obtained idealized tilings to the structures of considered capsids shows that the proposed approach is general for many structures of small and medium-sized viruses. Such tilings provides a general idea about quasi-equivalence of proteins, thus simplify the internal structure of protein molecules and viral genome. Our model provides a better insight into the protein structures of viral capsid, enabling a further research on virus models that do not comply to the conventional Caspar-and-Klug model.
Below is the model applied to five different types of icosahedral viruses - 3J3I(T=1), 2VF1(T=2), 1JS9(T=3), 2XFC(T=4), 3J4U(T=7):
(Although I did not find the unit patterns for T=4 and T=7 structures, the structural pattern is obvious in the 3D models.

Based on the developed models, I would like to continue researching on viral capsid models, especially on how the stability and structures of different subunits impact the assembly and disassembly pathway. I plan to carry out my analysis on a broader dataset and collect a more generalized modeling algorithm.
Author Information:
Jihyeon Je(Western Reserve Academy)
jej19@wra.net