Summary
Detailed digital information about water is of great important not only for urban design and development, but also for geopolitical strategic plans. A large portion of world population is now living in water stress regions. There are alarming patterns between the water crisis and political/civil unrest in parts of the world (e.g., Yemen, Syria, even Iran). Therefore, having digital model of water sources is essential. My main goal here is to extract the hydrographic basin (also called, the drainage basin) out of digital elevation models (DEM). Detailed watershed segmentation of a geographical region is obtained using built-in morphological functions of Wolfram language that I applied on the DEM of the region. The watershed lines dividing neighboring basins, together with their elevation values, are extracted. We treated the centroid of sub-basins as vertexes of a graph where connections between neighboring vertexes depend on the land surface characteristics and boundary lines. We assumed that a valid connection between two vertexes (say, two sub-basins) can be made only if the two vertexes have minimum elevation at the boundary compared to all neighboring vertexes. Our results show a great match with the the watershed segmentation obtained manually by appropriate choice of markers (say, using a seasoned geographer knowledge).
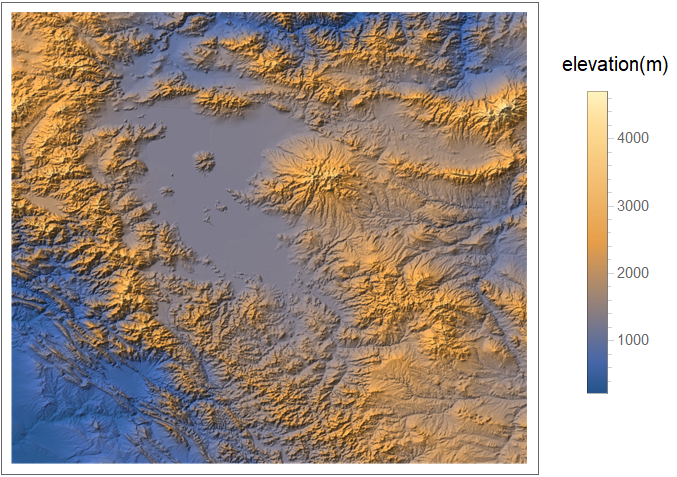
DEM of Lake Urmia (Orumiyeh, Persian: ??????)
The region that I choose for my analysis is lake Urmia on the north west of Iran. It is a UNESCO biosphere reserve which is now dangerously shrinking due to water mismanagement and also drought. We set the region a box between two points with altitudes and longitudes {35.5,44} and {39,48}. We extract the DEM using GeoElevationData function.
region = {{35.5, 44}, {39, 48}};
data = N[QuantityMagnitude@
    GeoElevationData[region, UnitSystem -> "Metric"]];
reliefmap =
 ReliefPlot[data, DataReversed -> True,
  PlotLegends -> BarLegend[Automatic, LegendLabel -> "elevation(m)"]]
Watershed segmentation
We covert the DEM data into an image.
mimg = ImageAdjust[Image[data]];
From now on, we shall treat our DEM as an image with colors corresponds to elevations. We find watershed segmentation (i.e., a detailed sub-basin structure) using Immersion method, mainly because the labeling of segments correspond to the relative value for a sub-basin's minimum elevation.
wsc = WatershedComponents[mimg, Method -> "Immersion"];
bnds = ColorNegate@Image[wsc, "Bit"];
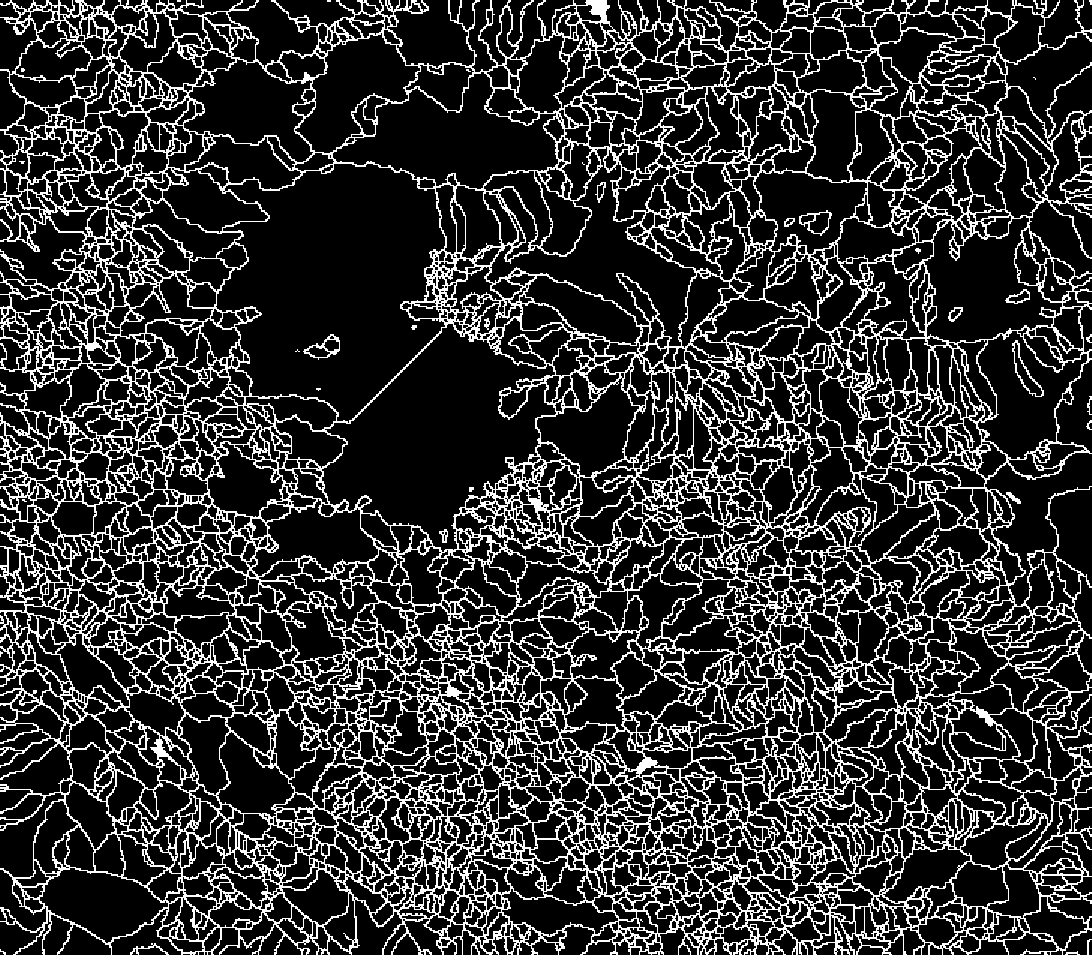
Next, we label the boundary between two adjacent sub-basins by the indexes of corresponding sub-basins. To do so, we use black-and-white image of watersheds where the boundaries (say, lines) have value one (white lines). Then, we assign two indexes to the line separating two sub-basins. These indexes are the indexes of adjacent sub-basins separated by the line. We shall do index assignment of lines in two steps:
Shift the sub-basin with higher index into the lines (using Erosion).
bindex = Erosion[Replace[wsc, 0 -> Max[wsc] + 1, {2}], 1];
Shift the sub-basin with lower index into the lines (using Dilation)
tindex = Dilation[wsc, 1];
The first step has one subtlety: to shift the higher index into the lines, first we need to set the boundary value higher than any value in the image; otherwise the Erosion function will extend the boundaries only.
doubleIndexArray =
  Replace[Transpose[{bindex, tindex}, {3, 1, 2}], {n_, n_} -> {0,
     0}, {2}];
doubleIndexPairs =
 Prepend[DeleteCases[
   DeleteDuplicates[Flatten[doubleIndexArray, 1]], {0, 0}], {0, 0}]
After labeling the boundaries by two indexes, we find the minimum elevation along the boundaries separating two sub-basins. Now we have the information of adjacent sub-basins and the minimum elevation along the boundaries.
bndSegs =
  Replace[doubleIndexArray,
   Dispatch@MapIndexed[#1 -> First[#2] - 1 &, doubleIndexPairs], {2}];
MinATborders =
 Thread[Rest[doubleIndexPairs] ->
   ComponentMeasurements[{mimg, bndSegs}, "Min"][[All, 2]]]
Graph made out of centroids of sub-basins
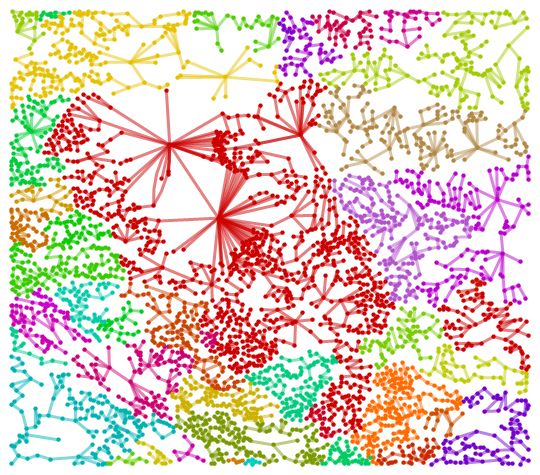
From now on, we shall treat a sub-basin as a vertex. For the sake of representation, the location of the vertex is set as the centroids of sub-basins. The most important question is how the vertexes are connected together and what are the corresponding clusters made out of connected vertexes. In other word, the clusters represent larger basins that form a unique hydro-graphical ecosystem with a unique water graph.
g0=Graph[Apply[UndirectedEdge,Rest@doubleIndexPairs,{1}]];
g1=WeaklyConnectedGraphComponents[g0][[1]];
basinConnect=Sort[Map[# -> AdjacencyList[g1,#]&,VertexList[g1]]]
sortBasin[x_]:=Keys[x]->SortBy[Values[x],Association[MinATborders][Sort[{#,Keys[x]}]]&];
sortedBasins=sortBasin[#]&/@basinConnect
Algorithm to make connections between sub-basins (how/where to connect vertexes and form edges)
- Built a set for each sub-basin whose elements are the adjacent sub-basins.
- Sort them by the minimum value of the boundary separating them.
- Make a connection between two adjacent sub-basin by choosing the first element of the sorted list in step#2
- Check for possible cycles in the graph (i.e., loops). If any, replace the original connection by the making the connection with the second element in the list of sorted sub-basins obtained in step#2.
- Repeat step#5 until there is no more change in the graph Here is the graph that we obtain following above steps:
# Comparison of our result with a basin structure obtained by pre-determined markers Let us assume that we are a seasoned geographer with a good knowledge of large basins (e.g., where the rivers are running and what branches of a river are independent and where they merge) and how they are connected on a map. Then, one shall obtain the following basins for our selected region:
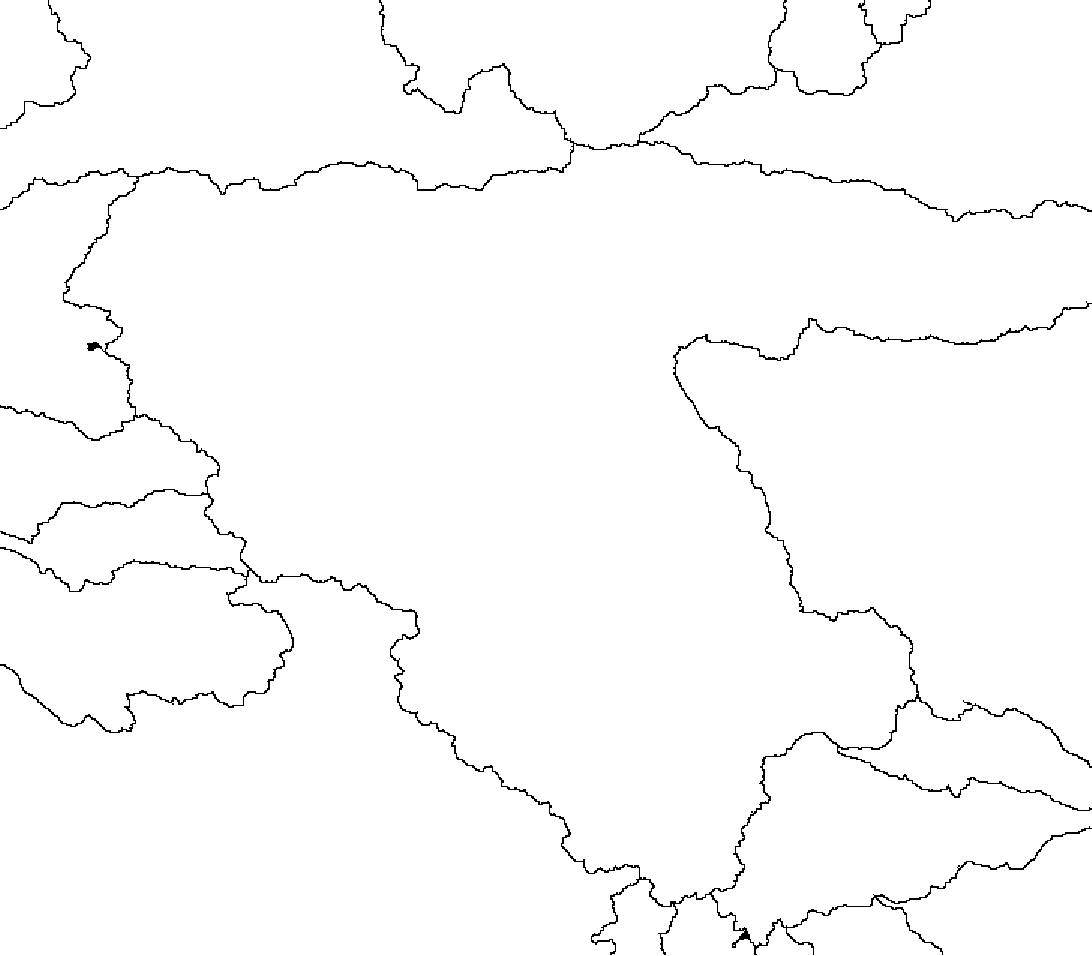
Now, let us overlay our graph on the top of map and compare different results
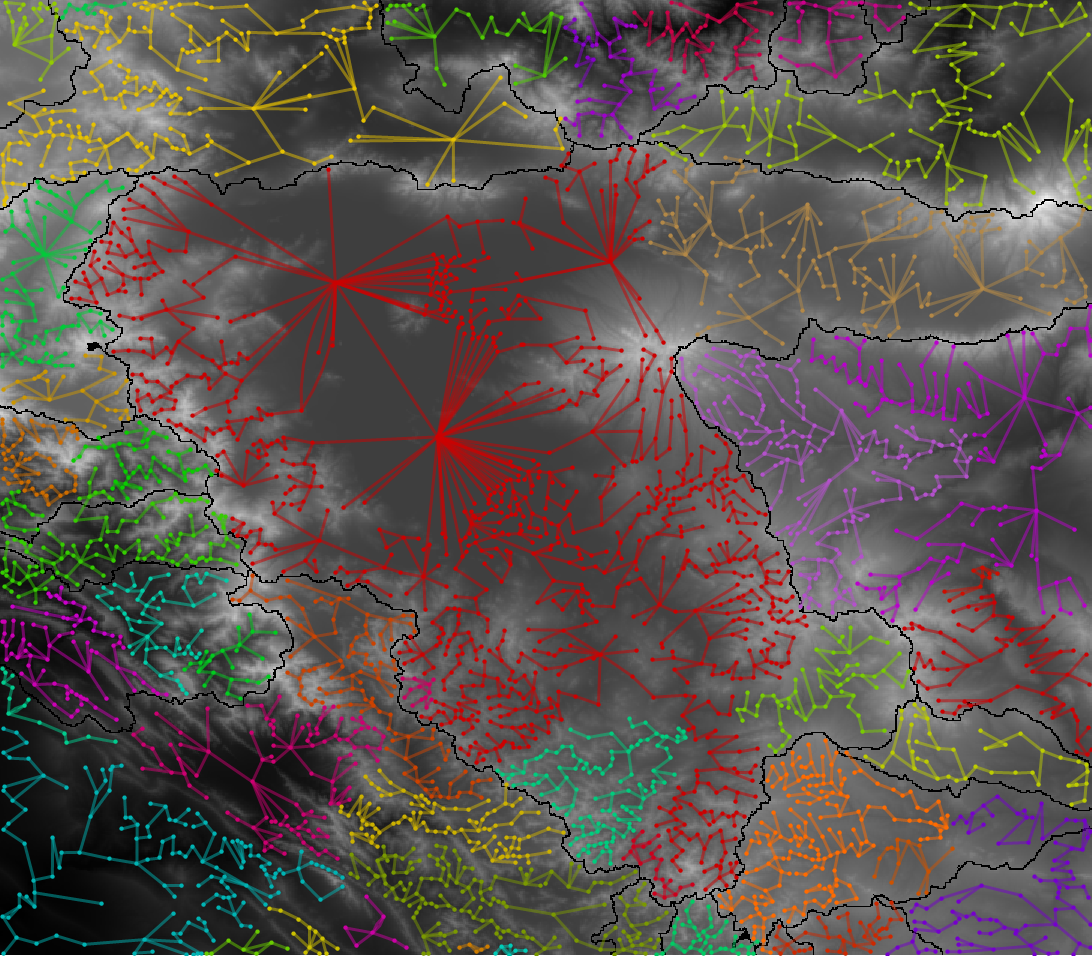
Concluding remarks
Detailed watershed segmentation of a geographical region is obtained using built-in morphological functions of Wolfram language that we applied on the raw Digital Elevation Model (DEM) of the region. The watershed lines dividing neighboring basins, together with their elevation values, are extracted from DEM. We treated the centroid of sub-basins as vertexes of a graph where connections between neighboring vertexes depend on the land surface characteristics and boundary lines. We assumed that a valid connection between two vertexes (say, two sub-basins) can be made only if the two vertexes have minimum elevation at the boundary compared to all neighboring vertexes. Our results show a great match with the the watershed segmentation obtained manually by appropriate choice of markers (say, using a seasoned geographer knowledge).
Future works
With the detailed dynamic relationships of hydrographic basins in force, we will be able to develop models describing the water flow (or water level) among basins using the precipitation data. Next, the water usage for irrigation and urban uses can be added into the model. Using these information, one will be able to develop an elaborate model for water management of a large hydrographic basin. Our approach can be improved further by treating a few loops (cycles) that appear in the graph. In this regard, one can remove the connection between two vertexes where the initial one has higher elevation and replace it with the second vertex in the list of neighboring basins sorted by the minimum boundary elevation.


