MODERATORS' NOTE: full code notebook is attached below
GitHub: https://github.com/NoahHardwicke/WSS18
Introduction
Transmission of information by radio is commonly implemented using frequency modulation (FM), where the instantaneous frequency of a carrier wave is varied in accordance to a modulating signal. Unlike amplitude modulation (AM), FM carries a high signal-to-noise ratio and is thus a favourable transmission method, especially for music where fidelity preservation of the original signal is important. My project was to implement an FM demodulator in the Wolfram Language.
Given an arbitrary wave $audio$ to be encoded in a carrier wave, the modulated signal $s$ is given by
$$s(t)=A_c \sin \left(2 \pi f_c+2 \pi f_{\Delta } \int_0^t audio\left(t'\right) \, dt'\right),$$
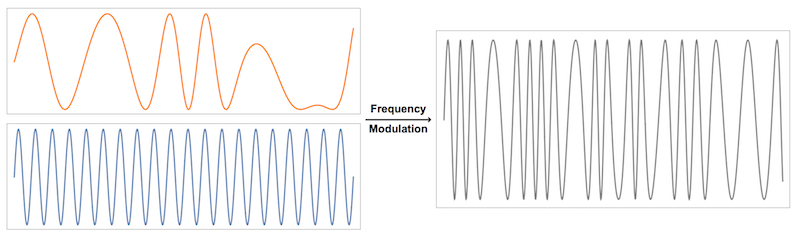
where $f_c$ and $A_c$ are the carrier wave frequency and amplitude respectively, and $f_{\Delta}$ denotes the maximum deviation in frequency from the carrier frequency. The following figure shows how the blue carrier wave is modulated according to the orange signal wave, which produces the frequency modulated wave shown in grey. The frequency of the modulated wave varies according to the amplitude of the signal wave.
To recover the original signal given a modulated wave, a direct approach might be to solve $s$ for $audio$, which gives
$$audio(t)=\frac{1}{2 \pi f_{\Delta } A_c} \frac{\dot{s}(t)}{\sqrt{1-\left(\frac{s(t)}{A_c}\right){}^2}}$$
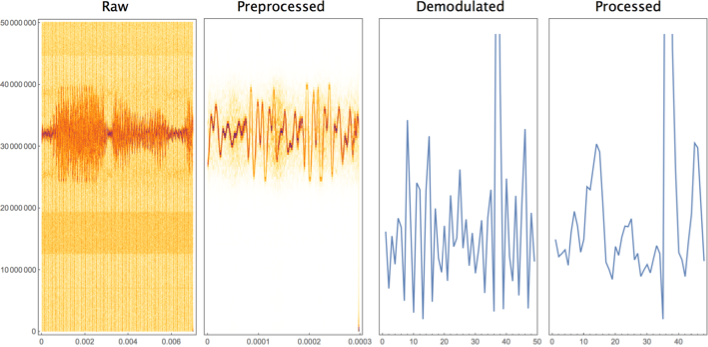
where $\dot{s}(t)$ is the time derivative of $s(t)$. Computing $\dot{s}(t)$ is nontrivial seeing as taking the differences of pairs of data shortens the data by one, so ideally $s(t)$ would be resampled where each new datum is the average of original pairs. This method of FM demodulation is called slope detection and is useful when the input signal is simply a list of real amplitudes. An example of this is shown below, where the wave on the left is has been encoded to create the middle signal. The rightmost wave is the recovered original wave, demodulated from the encoded signal. The animation shows how the addition of noise, to the point where the signal is unrecognisable, can be significantly reduced simply by averaging over the data. These processes involve applying windows of finite width to a discrete signal, and therefore the vertical lines in the filtered audio are artefacts of discrete signal processing. Avoiding and removing these is difficult.
Other demodulation methods can be used when using an external software defined radio (SDR) unit to record raw FM signal. SDRs output raw data as complex numbers, so the amplitude and phase deviation are immediately accessible. Therefore taking the Arc Tangent of the complex and real parts directly produces the original demodulated wave. The Arc Tangent function is computationally expensive, so instead the following approximation is used,
$${audio(t)}={A_c}\frac{\Re(s(t)) \Im\left(\dot{s}(t)\right)-\Im(s(t)) \Re\left(\dot{s}(t)\right)}{\Re(s(t))^2+\Im(s(t))^2}.$$
This method is called quadrature demodulation and utilises all information from the SDR; slope detection could only work here by taking either the real or imaginary part, thus discarding the remaining half of the data.
Data Acquisition and Preprocessing
The frequency limitations of sound cards prevent an antenna from being plugged directly into a computer to record MHz frequencies. Instead, an external SDR unit is used to digitise high-frequency analog signals, and this data stream is passed to the computer. It is unfeasible to process signals of such high bitrates in real time using Mathematica, so demodulation and filtering is done on recorded data files. Interfacing Mathematica directly with a SDR was achieved, however data could not be read recorded sufficiently quickly so a third-party application was used to record the data (Gqrx). Further work could be done to negate the need for the third-party application.
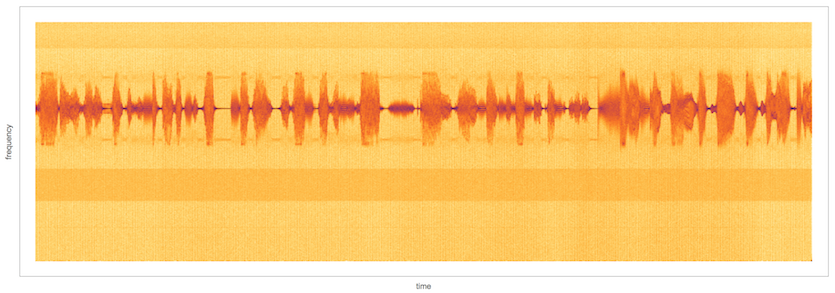
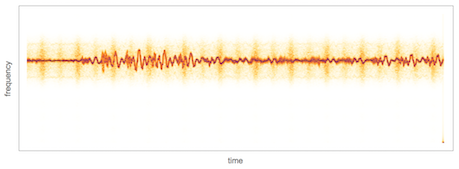
A spectrogram of the raw SDR data is shown below. It contains an FM signal at ~100MHz, where side bands that encode information about the station are visible as the two smooth bands on either side of the main signal.
The FM signal can be quickly filtered out by applying a bandpass filter around the frequency domain of the signal. Further reduction of noise is achieved by taking a Fourier transform, clipping out the noise by applying an amplitude threshold, and taking a reverse Fourier transform. The following three images show this process.
The power spectrum is computed.
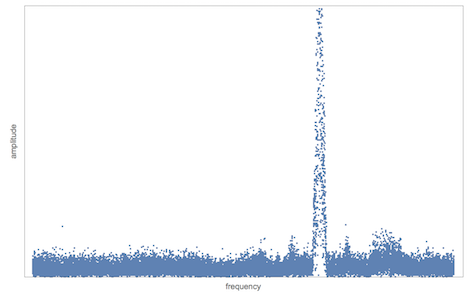
An amplitude threshold is applied to filter out noise.
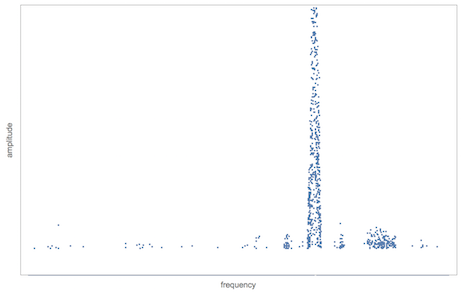
The inverse Fourier transform is taken (and band pass filter applied) to return the FM signal.
Demodulation
This filtered signal is then passed into the demodulation function. The image below shows the multitude of artefacts introduced into the signal due to discrete processing. Noise reduction filters such as Wiener filters and smoothing filters such as Gaussian filters are insufficient to clip out these artefacts, so a function that combs through the demodulated signal and identifies large local changes in gradient is used.
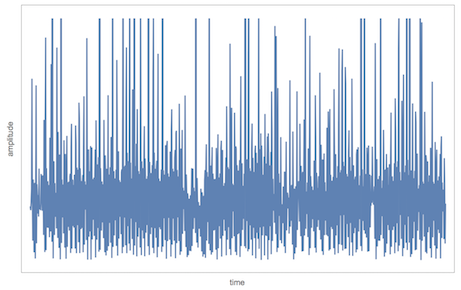
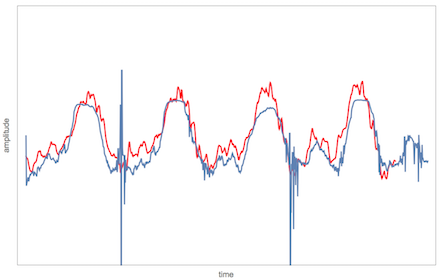
The result of this filter, along with a combination of other smoothing filters is shown below. The red signal is the ideal signal decoded by a commercial demodulator. Clearly more work is needed to remove artefacts, or prevent their generation entirely.
Final Thoughts
The ability to process FM signals in the Wolfram Language would be good to implement properly. My project has significant issues with noise and spurious artefacts introduced into the signal. It would be good to implement a system of interfacing Mathematica directly with common SDRs and recording high bitrate data. Clearly, however, this project has provided a proof-of-concept that FM processing is a feasible venture to pursue in the Wolfram Language.
 Attachments:


