What is this project?
This project is intended to let you experience the world how other people see and hear it. I Especially explore various auditory and visual impairments and simulate their effects. I hope this tool can go on to help friends and families understand what their loved ones are going through. Overall I set out to create an interactive display of different sensory deficiencies, and I believe in part I achieved my goal. Although I would like to add more things I got some of the most common/impactful ailments! I used two main sources to acquire my data http://www.roger-russell.com/hearing/hearing.htm https://www.sciencedirect.com/science/article/pii/S167229301150008X?via%3Dihub#bb0005
What does it look like?
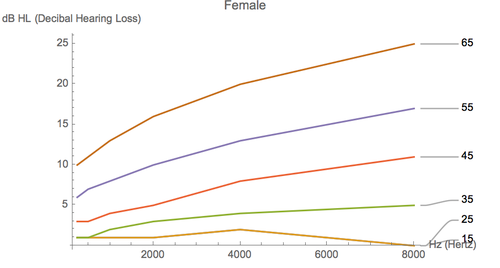
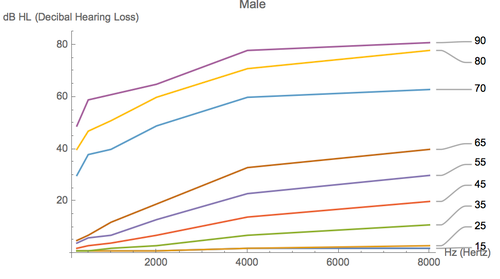
Below are instances of the simulation as well as rough regressions I made to supplement 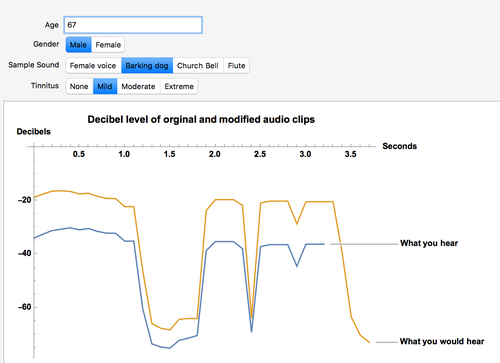
How did I Create this project?
In order to simulate frequency loss I used Fourier transforms isolate and lower (by a certain percentage) the decibel level of ranges of frequencies. To add tinnitus I had to play around with different functions in the audio space but eventually I was able to simplify it and go on to apply it. The bulk of my code is below it is the code which implements the Fourier transform AgeAlter[audio_, age_, gender_] := Module[{sampleRate, fromDezibel, amps, kernel, Data}, If[gender == "Male", Data = ApproximateAgeMale[age], Data = ApproximateAgeFemale[age]]; sampleRate = First@Values@Options[audio, SampleRate]; fromDezibel = x \[Function] Exp[-x/8.685889638065035`]; amps = MapAt[N@BlockMap[Mean, \[Pi] #/sampleRate, 2, 1] &, MapAt[fromDezibel, Transpose[Data], {2}], {1}]; kernel = LeastSquaresFilterKernel[amps, First@Values@Options[audio, SampleRate]]; e = AudioLoudness[ Audio[Map[channel \[Function] ListConvolve[kernel, channel], AudioData@audio], Sequence @@ Options[audio]]]; If[age < 0, "How Are you Alive???", If[age > 90, "You're either Dead or Deaf (Or you're hearing is far too \ negligible to simulate)", If[age <= 30, Grid[{{ListLinePlot[AudioLoudness[audio], PlotLabels -> "What you hear/would hear", PlotLabel -> "Decibel level of orignal and modified audio clips", LabelStyle -> {Black, Bold}, AxesLabel -> {"Seconds", "Decibels"}, ImageSize -> Large]}, {audio}}], Grid[{{ListLinePlot[{e, AudioLoudness[ AudioTrim[audio, (-1*(Duration[audio] * .88094189354))], Alignment -> Center]}, PlotLabels -> {"What you hear", "What you would hear"}, PlotLabel -> "Decibel level of original and modified audio clips", LabelStyle -> {Black, Bold}, AxesLabel -> {"Seconds", "Decibels"}, ImageSize -> Large]}, {Audio[ Map[channel \[Function] ListConvolve[kernel, channel], AudioData@audio], Sequence @@ Options[audio]]}}]]]]]
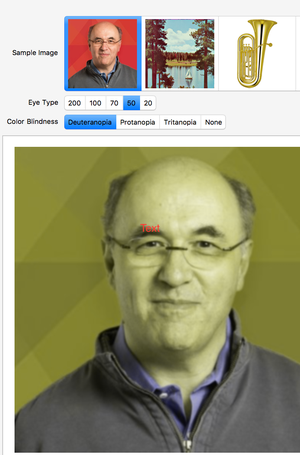
This code essentially takes in an audio file and corresponding age, it then transforms the audio into Fourier space and maps decimal lowering amounts across different frequency ranges. Since decibels use a logarithmic scale i often struggled dealing with different units and converting between them although a professor helped me work it out. Other than this the rest was not too difficult to implement, the visual aspects were just a simple blurring of the image and extracting different RGB values (using built in functions).
In the future
in the future I intend to improve and grow this project, expanding its reach for many different deficiencies, both applying the auditory and visual senses and not applying. I also hope to use this project, as a demonstration, to help raise awareness for people afflicted with these ailments or if this project becomes solidified enough, to directly make an impact on those who need it.


