Utilizing the Brélaz Heuristic to Produce Efficient Four-Colorings of Historical Geopolitical Maps
The goal of this project was to develop a system that provides a four-coloring of historical geopolitical maps, utilizing minimum cycle completion algorithms and the Brelaz coloring heuristic. The intention here was mostly as an intellectual exercise - the functional paradigm of the Wolfram language lends itself quite nicely to implementing a four-coloring of a map, and the magnitude of data available from the Wolfram Knowledge Base allowed a very nice application of this mathematical theorem to a real-world example, and I thought it would be interesting to combine the two in an application.
Beginnings
Wolfram has a very nice collection of the polygons of historical countries in its data repository. This data was used to develop the maps of the historical countries.
Unfortunately, however, the entities in "HistoricalCountries" don't have a "BorderingCountries" property. This was a little bit troublesome, as it was necessary to know the bordering countries in order to color the map. A BorderingCountries function was written to remediate this.
getRegion[polygon_] :=
 DiscretizeGraphics@
  Cases[polygon, Line[a___], Infinity]

BorderingCountries[countries_, country_, c1_, year_] :=
 Module[{pts, r},
  pts = Identity @@@
    MeshPrimitives[getRegion[Dated[country, year]["Polygon"]], 0];
  r = Table[Min[RegionDistance[i, pts]], {i, c1}];
  Pick[countries, Thread[r < 0.03]]
  ]
This function retrieved every country within a latitude/longitude range of 0.03° that had a polygon for the given input year. This will be used later in the map generation function.
First Attempts at Coloring
I began by declaring variables and methods for ensuring all of the countries were properly called and mapped onto Wolfram's default world spread:
yearWorldMap[i_] :=

 toColor[tf_] := <|{False, False} -> Red, {False, True} -> Blue, {True, False} -> Green, {True, True} -> Yellow|>[tf]

 Module[{},

  year = DateObject[List[i], "Year", "Gregorian", -4.`];

  inrange =
   Keys@Select[CloudImport@CloudObject["HistoricalCountries.wxf"],
     yearWithinQ[year, #] &];

  countries = Pick[inrange, Not@*MissingQ /@ EntityValue[Dated[inrange, year], "Polygon"]];

  c1 = getRegion /@ (EntityValue[Dated[countries, year], "Polygon"]);

  countryneighbors = {#, DeleteCases[BorderingCountries[countries, #, c1, year] , #] } & /@ countries;

  countrybooleans = # -> {x[#], y[#]} & /@ countries;
Then, the first attempt at a minimum vertex cycle algorithm was implemented (and also put into the yearWorldMap module).
eqs = And @@ (Flatten[
     Function[{c, n},
       BooleanConvert[Xor[x[c], x[#]] || Xor[y[c], y[#]], "CNF"] & /@
        n] @@@ countryneighbors]);

solution =
  Join[Replace[
    FindInstance[eqs, Union[Cases[eqs, _x | _y, \[Infinity]]],
     Booleans], {{first_, ___} :> first, _ :> {}}],
   Flatten[{x[#] -> True, y[#] -> True} & /@
     Flatten[Cases[countryneighbors, {_, {}}]]]];

coloring =
  Quiet[(Dated[#[[1, 1, 1]], year] ->
       Lighter@Lighter@toColor[Last /@ #]) & /@
    Partition[SortBy[solution, #[[1, 1]] &], 2]];
For early history (1000 BC to 100 BC), this algorithm was reasonably fast. However, many issues emerged during testing:
The threshold r used for the BorderingCountries function was a little bit strange to work with. Initially, if the r value was hard to obtain with the cycling algorithm, because the algorithm would fail if the r provided was too big and returned any overlapping country polygons. However, after much experimentation, I was able to get a satisfactory r value.
The development process under this algorithm was very tedious. There were many variables to keep track of, and many things broke very often. For instance, whenever there was a country overlap and the computer couldn't distinguish between polygons, it often defaulted to the (True, True) condition, leaving most of the map blank and only using the color yellow when the condition applied.
Perhaps the most glaring issue was that the minimum cycle algorithm became extremely slow for more recent years. This is because more countries existed as time moved forward, and thus, the algorithm takes much longer to color the map (the minimum cycle vertex algorithm completes in exponential runtime).
Using the Brélaz heuristic
After much testing, I finally decided that I needed to remove the minimum vertex cycling algorithm, as it was simply too computationally expensive and inefficient to implement at the scale I desired for this project.
Of course, that meant figuring out another algorithm to use.
Prior to Version 11 of Mathematica, a graph theory package called Combinatorica had a simple function called BrelazColoring that would color a graph according to the Brélaz heuristic¹, which provides good, but not necessarily minimal colorings for a graph. As the goal for this project was to four-color a map, using the Brélaz heuristic as the basis for the coloring method was a good idea because a minimal coloring wasn't absolutely necessary the map was a good idea.
To use BrelazColoring, I first needed to convert my world map into a graph, color the vertices of the graph, and then apply the coloring to the map. The code I used to do so was
Quiet[<< Combinatorica`]
rules = Thread[# -> Range[Length[#]]] &@
Union[Flatten[countryneighbors]];
edges = List /@ Join @@ Thread /@ countryneighbors /. rules;
vp = List /@ RandomReal[{0, 1}, {Length[rules], 2}];
colors = BrelazColoring[Graph[edges, vp]];
polys = EntityValue[Thread[Dated[rules[[All, 1]], year]], "Polygon"];
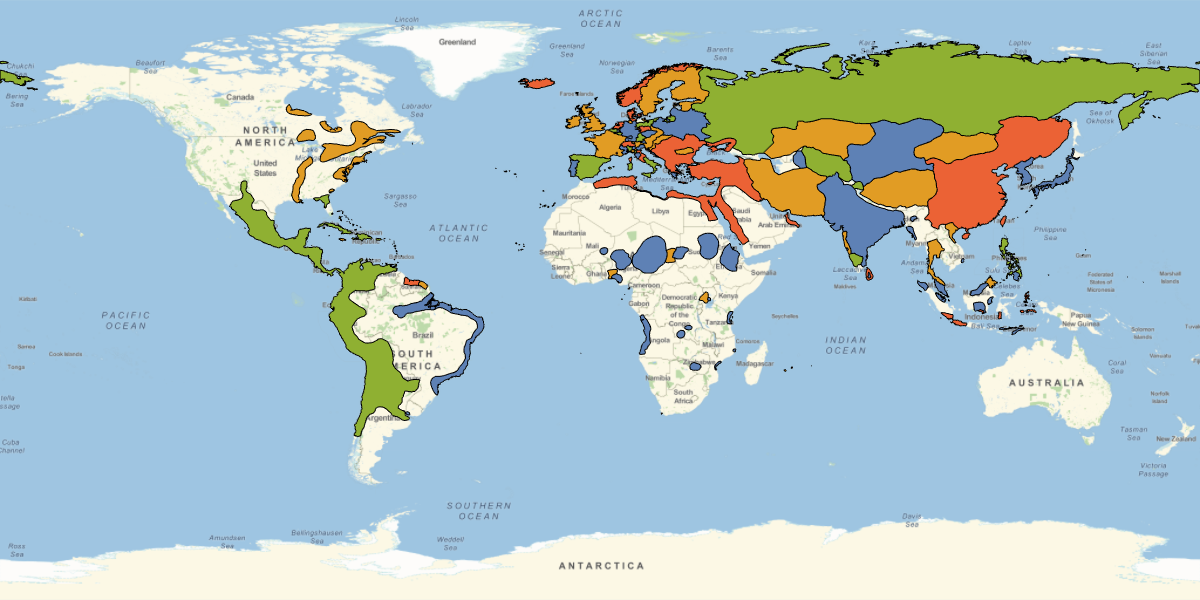
This worked very well, and was able to produce accurate four-colorings of historical maps,
Making the Microsite
What is a good function without a nice place for other people to use?
As mentioned in the introduction of this post, a major portion of this project was the real-world applicability of the map function. To allow others to use it, I decided to create a microsite hosted on the Wolfram Cloud.
I wanted a little bit more than a simple FormPage, so I added a little bit of styling to the website:
CloudDeploy[
 FormPage[{"Year" -> <|
     "Interpreter" -> Restricted["Integer", {-1000, 2018}],
     "Help" -> "Use a hyphen (-) for BC years.",
     "Hint" -> "Enter a year"|>},
  Once[yearWorldMap[#Year], "Cloud"] &,
  AppearanceRules -> <|"Title" -> "<b>Maps</b> Throuhgout History",
    "Description" ->
     "</style>Enter a number to see the geopolitical map for that \
year. After, click below to see a video of the map changing over \
time.", "SubmitLabel" -> "Give me the map!",
    "PageTheme" -> "Blue"|>], "Maps", Permissions -> "Public"]
You can access the microsite here.
Future Work
As of right now, the function that generates a map only works for years ranging from 1000 BC to 1950 AD. This is because, after much experimentation, I failed to find a way to incorporate the polygon's of modern countries into my code without destroying the modern map. I do intend to find a solution to this, and extend the AD range of the mapping function to 2018 (or whatever the current year, assuming I have enough cloud credits to sustain it into the future.)
¹As a side note, the reason Brélaz got a "heuristic" and not an "algorithm" named after him is because graph coloring is computationally hard and is an NP-complete problem. In general, NP-complete problems cannot be solved by algorithms in a reasonable amount of time (they need exponentially more time to solve); however, because the Brélaz heuristic often gives such good results, it is often referred to as an algorithm; even


