Message Boards Message Boards

Display a Fit equation on a plot?

Hi,

Could you please let me know, how I can display fit equation and correlation coefficient value on plot?

Thanks for your help :)

data1 = {0, 1, 3, 5}

data2 = {1, 0, 2, 4}

R = Correlation[data1, data2] // N

data3 = Transpose@{data1, data2};

line = Fit[data, {1, x}, x]

Show[ListPlot[data, PlotStyle -> {PointSize@Large, Red}], 
 Plot[{line}, {x, 0, 5}]]
POSTED BY: M.A. Ghorbani
3 Replies

Dear Gianluca and Mariusz,

Thank so much for your useful response.

Regards,

POSTED BY: M.A. Ghorbani

Maybe so:

 data1 = {0, 1, 3, 5};

 data2 = {1, 0, 2, 4};

 R = Correlation[data1, data2] // N;

 data3 = Transpose@{data1, data2};

 line = Fit[data3, {1, x}, x];

 Show[ListPlot[data3, PlotStyle -> {PointSize@Large, Red}], 
  Plot[Evaluate[line], {x, 0, 5}, PlotLabels -> "Expressions", 
   PlotLegends -> Placed["R=0.9022436", {8/10, 8/10}]], 
  PlotRange -> {{0, 8}, Automatic}]
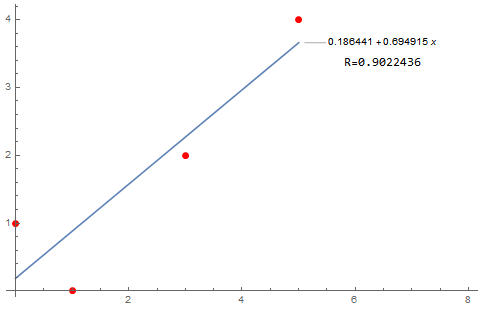
enter image description here

 Show[ListPlot[data3, PlotStyle -> {PointSize@Large, Red}], 
  Plot[Evaluate[line], {x, 0, 5}, 
   PlotLabels -> 
    Placed[{"y(x)=0.186440\[VeryThinSpace]+0.694915 x"}, {2, 3.5}], 
   PlotLegends -> Placed["R=0.9022436", {0.34, 7/10}]]]
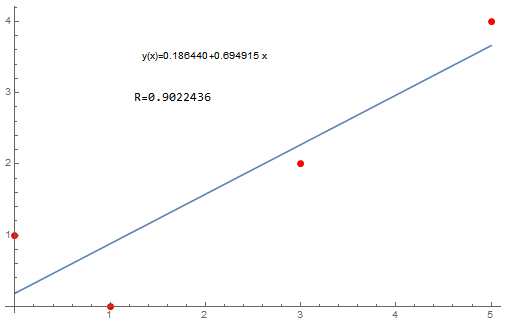
enter image description here

POSTED BY: Mariusz Iwaniuk

You can use Epilog, or a Graphics:

Show[ListPlot[data, PlotStyle -> {PointSize@Large, Red}], 
 Plot[{line}, {x, 0, 5}], 
 Graphics[Text[Row[{"correlation = ", R}], Center]]]
POSTED BY: Gianluca Gorni
Reply to this discussion
Community posts can be styled and formatted using the Markdown syntax.
Reply Preview
Attachments
Remove
or Discard

Group Abstract Group Abstract