Maybe so:
data1 = {0, 1, 3, 5};
data2 = {1, 0, 2, 4};
R = Correlation[data1, data2] // N;
data3 = Transpose@{data1, data2};
line = Fit[data3, {1, x}, x];
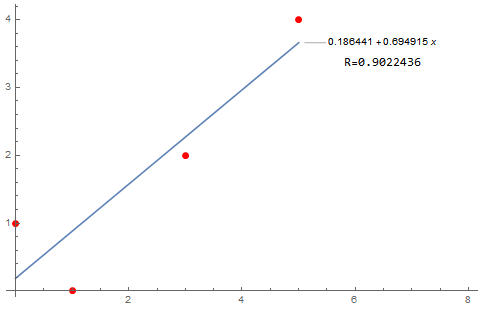
Show[ListPlot[data3, PlotStyle -> {PointSize@Large, Red}],
Plot[Evaluate[line], {x, 0, 5}, PlotLabels -> "Expressions",
PlotLegends -> Placed["R=0.9022436", {8/10, 8/10}]],
PlotRange -> {{0, 8}, Automatic}]
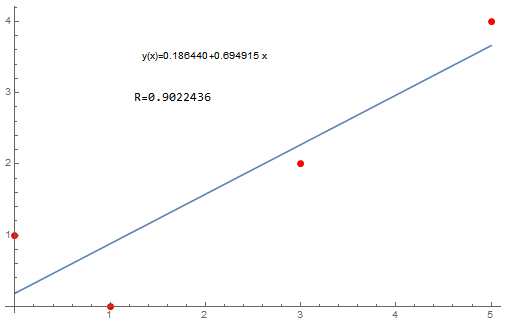
 Show[ListPlot[data3, PlotStyle -> {PointSize@Large, Red}],
  Plot[Evaluate[line], {x, 0, 5},
   PlotLabels ->
    Placed[{"y(x)=0.186440\[VeryThinSpace]+0.694915 x"}, {2, 3.5}],
   PlotLegends -> Placed["R=0.9022436", {0.34, 7/10}]]]