Group Abstract Group Abstract

Message Boards Message Boards

Accurately calculate tick tock period of mechanical watches?

Posted 7 years ago

I'm looking to find the frequency of a relatively large dataset (or a relatively short audio file) of a repeating sound, like so:
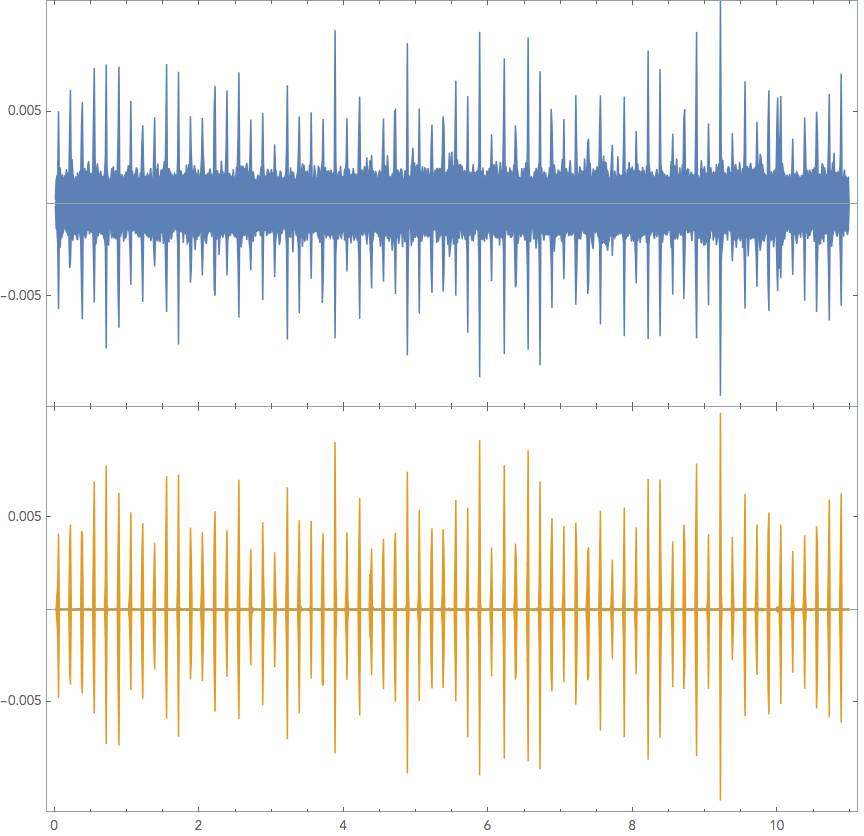
sound Here are the original files, for those willing to play. :) eta2412 data1 Other examples: phenix140sc chaika1601

Blue is the original soundwave, and orange is a Highpass and Wiener filtered form at 44100Hz sample.

A finely zoomed in picture of each "tick" (unfiltered in an audio program) looks like so: enter image description here
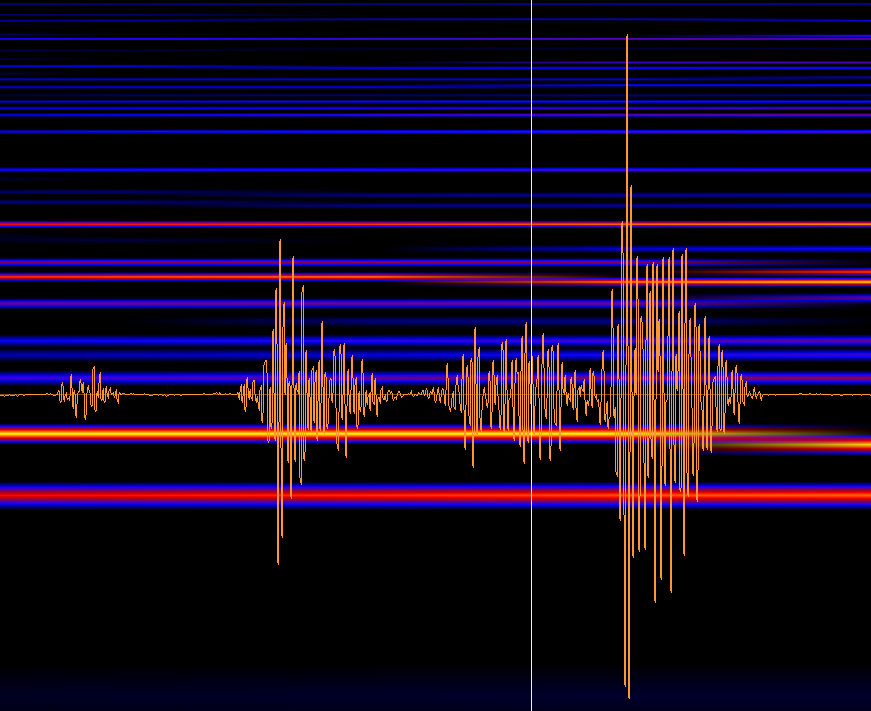
It's extremely oscillatory, however, there is a clear and obvious local maximum (when zoomed in far enough anyways (the duration of a tick is 0.016s or so)

I'm not particularly interested per say in the amplitude, however what I'd like to do, is to be able to automate and count the freq. of the "beats/ticks". This is currently done 'by hand' for each individual file I have to deal with and when a person has MMA...well, you get the point

Accuracy is a must in this case, the possible periods of the beats are at 0.200 [s] and 0.166 [s] repeating (5hz, and 6hz respectfully). Any kind of drift more than +/-0.002 second isn't acceptable.

Through many readings of this link, this link,this (the last link does nearly what but alas it's bpm) and many others, I've managed to cobble together something...that doesn't seem to get me anywhere.

dir = NotebookDirectory[];
SetDirectory[dir];
file = "eta2412.m4a";
snd = Import[file];
sndhpf = HighpassFilter[snd, 20000];
sndwf = WienerFilter[HighpassFilter[snd, 20000], 25];
sndSampleRate = Import[file, "SampleRate"];
p1 = AudioPlot[snd,  PlotRange -> {{0, 5}, {-1*10^-2, 1*10^-2}}];
p2 = AudioPlot[sndwf, PlotRange -> {{0, 5}, {-1*10^-2, 1*10^-2}}, PlotStyle -> Purple];
p3 = AudioPlot[sndhpf, PlotRange -> {{0, 5}, {-1*10^-2, 1*10^-2}}, PlotStyle -> Green];
data = Flatten[AudioData[sndwf]];
data1 = Drop[data, {50000, Length[data]}];

I've attempted to do audio processing itself,

getting to

res = AudioLocalMeasurements[sndwf,"RMSAmplitude",PartitionGranularity ->{Quantity[0.1, "Milliseconds"],Quantity[0.1, "Milliseconds"]}];
ListLinePlot[res, PlotStyle -> Red, PlotRange -> {{0, 2}, {0, 0.005}}]

Show[AudioPlot[sndwf, PlotRange -> {{0, 5}, {0, 0.005}}],ListLinePlot[res, PlotStyle -> Red, PlotRange -> {{0, 5}, {0, 0.005}}], AspectRatio -> 3/6, ImageSize -> "Large"]
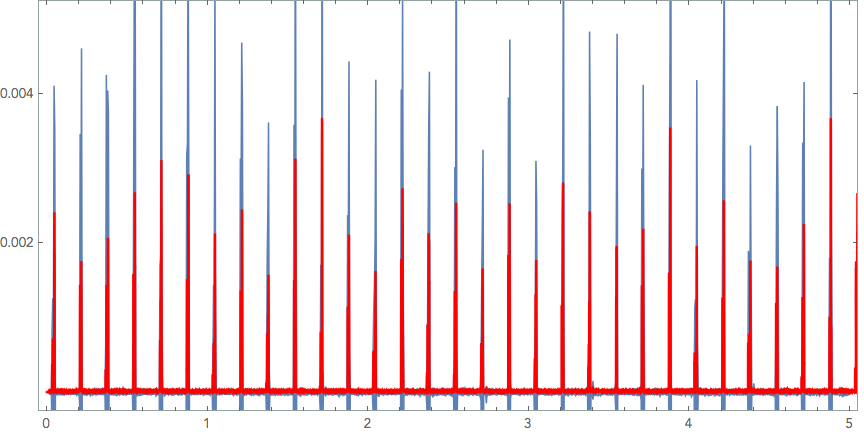
show

Now, I'm unfortunately at a complete loss on how to get each ticks local peak and calculate their global frequency, or rather, period.

How would one go about this? I've tried in Fourier as suggested in other posts..but the noise seems too extreme to give me anything I can understand or use to get further.

ListLinePlot[p = PeriodogramArray[data1], PlotRange -> All, ImageSize -> Large]
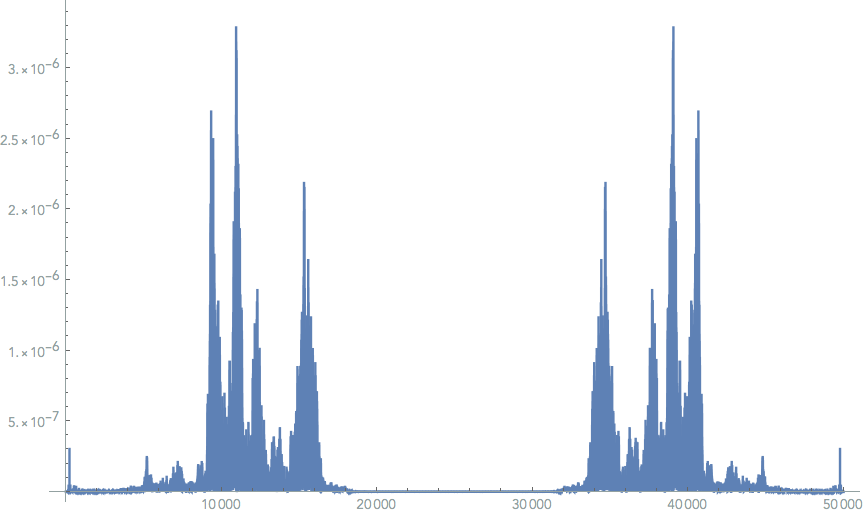
fourer

I have posted this over at stackexchange as well, incase this seems familiar to anyone. But I figured I'd try to hit two birds with two stones, should someone there post a solution I"ll gladly update it here. Thanks for the help! :)

POSTED BY: Mor Bo
16 Replies
Posted 6 years ago

Hi GIlmar, sorry for such a long time to reply, I've been out travelling for some time.

Here are the data files, assuming it's still interesting for you!

zim

phenix 140sc

phenix130

The eta is apparently missing, and infact, I don't seem to have the original file on my laptop anymore.

POSTED BY: Mor Bo

@ Mor Bo (01/04/2019) I see that Dr. Neil Singer was the author of "TickingClock.nb" but, my request about the eta2412 file still holds. Thank you! Gilmar Rodriguez-Pierluissi

@ Mor Bo (01/04/2019) : You provided "TickingClock.nb". Can you provide your "eta2412 data1" as another attachment available in this Mathematica Community post? Your internet link to this data file (and other data files above) are no longer working. Thank you! Gilmar Rodriguez-Pierluissi

Posted 7 years ago

@dontsaywe

I haven't heard a word why OP didn't say why he hadn't used a Tektronix Oscilliscope and whether the OS had given him the answer rather immediately (as is my guess it would do).

I feel like you didn't read.

Yes, I could have simply bought an expensive OS...or you know, the proper machine...like a watch timing machine. And not even wasted the time or money messing around with an OS. Or, if you read my post correctly, you would have noticed I was already using the correct software to analyse and count the audio clip accurately to begin with. Inventing the wheel twice is obviously kinda silly. Again, I agree with you 100%.

you shouldn't bother writing custom software for something you can get cheaply off (ebay amazon etc) that will be far better. it would be like buildign your own custom radio to listen to news

I shouldn't bother doing anything I guess because the industry already did it for me....

Hackaday Here is a nice site for you to gander at. It might help to understand my point.

I'm never going to learn MMA, nor am I ever going to learn how people before me managed to get their things to work in their black box electronics and already compiled code if I don't attempt (with help obviously) to do anything except open my wallet.

Why did I even bother buying MMA If I didn't plan on using any of its features, like audio processing or countless others. If I can just buy something else to do it.

Mr Wolfram should have just bought a matlab license I guess instead of making Mathematica?

improvements, if you offer any, to using MM as an OS would be neat but who will pay? i don't want to discourage improvements to mm :) certainly others have been doing so

I don't give a damn about money, I'm doing my own research not trying to improve MMA, not sell a product, nor sell MMA.

I appreciate you trying to, what you said, "point the OP in the right direction and not wasting others time" or whatever you thought. And your right, there are already solutions, Watch timing machines designed by the industry for hobbiest, professionals and consumers to buy.

But thats not the point now, is it?

I appreciate the thought you're trying to make, Really I do, thank you for your suggestion. In another situation, I'd probably take your advice. I'm not trying to be stiff, or discourage your comments. But Its obvious we have two wildly different views on learning.

POSTED BY: Mor Bo
Anonymous User
Anonymous User
Posted 7 years ago

I feel like you didn't read

i've read it again i see no mention that you already had a solution and were duplicating it for hobby

the OS i showed is obviously just one model - i did not say it was the least cost model needed

POSTED BY: Anonymous User
Anonymous User
Anonymous User
Posted 7 years ago
POSTED BY: Anonymous User
Anonymous User
Anonymous User
Posted 7 years ago

I haven't heard a word why OP didn't say why he hadn't used a Tektronix Oscilliscope and whether the OS had given him the answer rather immediately (as is my guess it would do).

OP has to name a range (a time range / sweep / horiz) certainly, volts (vertical if applicable), and also the sampling rate for an answer to be formed, i think.

The question of if OS software is freeware and Mathematica has Tektronix software built in, i'm unsure of. Mathematica has many signal analysis functions built-in: but it is not arrange so to make it a drop in replacement for an OS front end.

enter image description here

POSTED BY: Anonymous User

Mor,

Even after fixing the algorithm I do not agree with your manual findings on the Phenix. Are you sure it is correct?

Also, you have to balance the resolution of the FFT with the resolution of what you collect. For example, you have only 6 ticks per second for 60 seconds = 360 events. This fact limits your resolution as well.

Regards,

Neil

POSTED BY: Neil Singer

Mor,

Firstly, is there a reason that you didn't filter the audio files? There is a lot of background noise in the recordings. Or was this simply not required, being FindPeaks ignored anything below 0.002?

I only looked at the one data set so I did not see that the other sets have more noise in them. I agree with you that the filtering helps (especially the noisy sets). I was able to get away with leaving the noise on the eta2412 data so I saved the step. I applied your WeinerFilter and all data sets are improved by less noise and the PeakDetection works better.

The key to the Peak detect is to not have peaks appear in between the ticks. I raised the threshold so only clusters of peaks form on the "tick". The values I used for both the chiaka and phenix was

binarypeaks = PeakDetect[sndData, 0, 0.001, 0.0002];

Where sndData is filtered with your Weiner filter as shown in your post.

What did you mean by DC? A resonsant frequency of some kind?

DC refers to a steady state offset -- the data with a bunch of 1's and 0's has a mean that is not at zero. There are two ways to deal with that -- one way is to subtract the mean before taking the Power Spectrum. Second is to ignore the peak at the first data point (which is the zero frequency point or "DC")

You mentioned the length of the data was low...the other files are around 60 seconds or so. If I use a longer file length, would the 0 padding be required? To be honest, I'm not sure I quite understand the additional padding at all. But you don't need to explain it.

The resolution of the Fourier transform or Power spectrum is directly related to the time duration of your signal. If you have a 10 second signal you will have 6 times lower resolution in determining frequency information than if you have a 60 second signal. You can manipulate this a bit by padding the signal with zeros. You will get no more frequency information and your peaks will slowly shrink as you add more zeros, but you can increase the resolution this way. I changed the script to pad with 6 times your signal length to do the 60 second samples and that gave a good resolution. (even with this padding I only am getting 4 decimal places on the period -- is this good enough for you?). There are some clever ways to increase this without increasing the data size but I would need to understand your issues a bit more. (ie. anti-aliasing and downsampling -- you really do not need 44khz for this, taking longer samples instead of padding, and others)

I find this problem interesting . I also have some ideas on how to significantly improve things. I'd recommend you email me directly at "NeilS" at the domain in my profile. We should probably talk directly.

Regards,

Neil

POSTED BY: Neil Singer
Posted 7 years ago

I will write you an email today, as soon as I get a chance! Definitely looking forward to working with you on this problem :)!

POSTED BY: Mor Bo
Posted 7 years ago
POSTED BY: Mor Bo

Mor,

One other thought -- I also realized that the technique above is insensitive to the parameters to the PeakDetect. For example,

peaks = FindPeaks[sndData, 0, 0.002, 0.002];

Works fine so you should be able to generalize the algorithm to different audio clips -- you may only have to adjust the one number -- the amplitude cutoff for your clip loudness.

Did you try what I posted? Is this what you wanted? If so, I will cross post it in StackExchange.

Regards,

Neil

POSTED BY: Neil Singer
Attachments:
POSTED BY: Neil Singer
Posted 7 years ago

Hi Daniel! Ahh here are some links for the audio files, with .mp3 extension....the m4a are typically Apple. I attempted to something similar with MaxPeak, however it seemingly failed with the line plot only returning 1s (likely my poor MMA skills at work here)...The only issue I could see with it however, is that there isn't any nice cutoff for maximum peaks, between different movements things can change wildly.

I'll look into trying clip, hope the mp3s are useful :) in the meantime.

phenix140sc chaika1600 eta2412

POSTED BY: Mor Bo

Apparently my Linux machine does not like that format, so I cannot experiment. From the pictures, I wonder if you might use Clip to set values above some threshold to 1, and below to 0. The main frequency might then be more easily obtained from Fourier or similar.

POSTED BY: Daniel Lichtblau
Posted 7 years ago
POSTED BY: Mor Bo
Reply to this discussion
Community posts can be styled and formatted using the Markdown syntax.
Reply Preview
Attachments
Remove
or Discard