If you use GeoHistogram with triangle, rectangle or hexagon bins, and leave the default Tooltip behavior, then you can use the following to convert it to a 3D geo histogram:
GeoHistogram3D[input___, {options3D___}] :=
Module[{gh, polys, p2, hist, gb, poly, texture, im, boxAspectRatio},
  gh = GeoHistogram[input];
  polys = Cases[gh, {color_, Tooltip[x : Polygon[___], val_] /; FreeQ[x, GeoGridPosition]} :> {x, val, color}, Infinity];
  p2 = polys /. {Polygon[x_List], h_, color_} :> {
    color,
    Polygon@ Join[
      {x /. {f1_?NumericQ, f2_?NumericQ} :> {f1, f2, 0}},
      {x /. {f1_?NumericQ, f2_?NumericQ} :> {f1, f2, h}},
      Append[Partition[x, 2, 1], {First[x], Last[x]}] /.
        {{x1_?NumericQ, y1_?NumericQ}, {x2_?NumericQ, y2_?NumericQ}} :> {{x1, y1,0}, {x2, y2, 0}, {x2, y2, h}, {x1, y1, h}}]
    };
  hist = Graphics3D[p2];
  gb = PlotRange /. Options[gh, PlotRange];
  poly = {{gb[[1, 1]], gb[[2, 1]], 0}, {gb[[1, 1]], gb[[2, 2]], 0}, {gb[[1, 2]], gb[[2, 2]], 0}, {gb[[1, 2]], gb[[2, 1]], 0}};
  texture = GeoGraphics[Frame -> False, Options[gh]];
  im = Graphics3D[{Lighting -> "Neutral", Texture[texture], Polygon[poly, VertexTextureCoordinates -> {{0, 0, 0}, {0, 1, 0}, {1, 1, 0}, {1, 0, 0}}]}];
  boxAspectRatio = (gb[[1, 2]] - gb[[1, 1]])/(gb[[2, 2]] - gb[[2, 1]]);
  Show[im, hist, options3D, BoxRatios -> {boxAspectRatio, 1, 0.1}, Boxed -> False]
]
Input is the sequence of arguments for GeoHistogram, and the last list is for adding Graphics3D options.
Though you can add frames and ticks to the 2D GeoHistogram, the frame is removed from the underlying 2D image. I've chosen BoxRatios values that match with the original aspect ratio of the map produced by GeoHistogram, but you can change these by setting BoxRatios as a 3D option.
Options like ColorFunction and GeoProjection are respected. Let's look at some examples:
Example 1:
reg = Polygon[First@ CountryData["UnitedKingdom", "Coordinates"]];
nums = Join[
   RandomVariate[MultinormalDistribution[First@GeoPosition[Entity["City", {"London", "GreaterLondon", "UnitedKingdom"}]], IdentityMatrix[2]/4], 10^3],
   RandomVariate[MultinormalDistribution[First@GeoPosition[Entity["City", {"Edinburgh", "Edinburgh", "UnitedKingdom"}]], IdentityMatrix[2]/4], 10^3]];
numsGood = Pick[nums, RegionMember[reg][nums]];
gh = GeoHistogram[numsGood, {"Triangle", 50}, GeoProjection -> "Albers", GeoBackground -> "Coastlines"];
gh3D = GeoHistogram3D[numsGood, {"Triangle", 50}, GeoProjection -> "Albers", GeoBackground -> "Coastlines", {ViewPoint -> {0, 0, \[Infinity]}, ViewVertical -> {0, 0, 1}}];
Row[{Pane@ gh, Pane@ gh3D, Pane@ gh3D}]
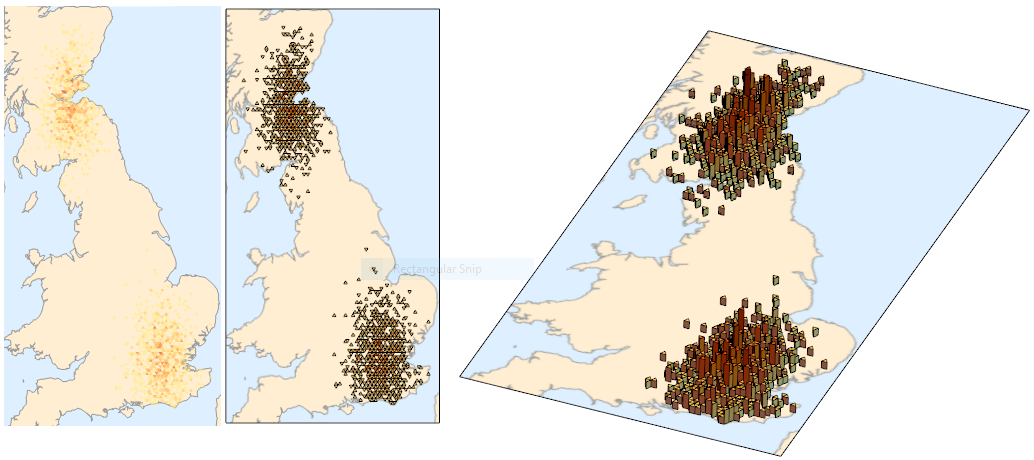
At least by eye, the bins appear to be in the correct positions.
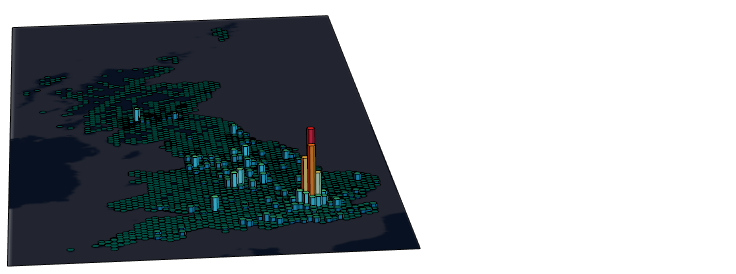
Example 2:
Taking https://tctechcrunch2011.files.wordpress.com/2017/04/hex.gif?w=738 as inspiration, we can get data from here, take the appropriate lat-long data, and insert it:
data = Import["C:\\Users\\<username>\\Downloads\\dftRoadSafety_Accidents_2016.csv", "CSV"];
all = data[[2 ;;, {5, 4}]];
GeoHistogram3D[all, 60, ColorFunction -> (Blend[{
        RGBColor[0., 0.4470588235294118, 0.596078431372549],
        RGBColor[0.2901960784313726, 0.9764705882352941, 0.9490196078431372],
        RGBColor[0.8, 0.996078431372549, 0.807843137254902],
        RGBColor[0.9176470588235294, 0.9607843137254902, 0.5254901960784314],
        RGBColor[0.9764705882352941, 0.6196078431372549, 0.1803921568627451],
        RGBColor[0.9176470588235294, 0.17647058823529413`, 0.27450980392156865`]}, #] &),
        GeoBackground -> GeoStyling[{"Coastlines",
          "Land" -> RGBColor[0.03137254901960784, 0.06666666666666667, 0.12941176470588237`],
          "Ocean" -> RGBColor[0.13333333333333333`, 0.1450980392156863, 0.18823529411764706`],
          "Border" -> RGBColor[0.03137254901960784, 0.06666666666666667, 0.12941176470588237`]}], {}]
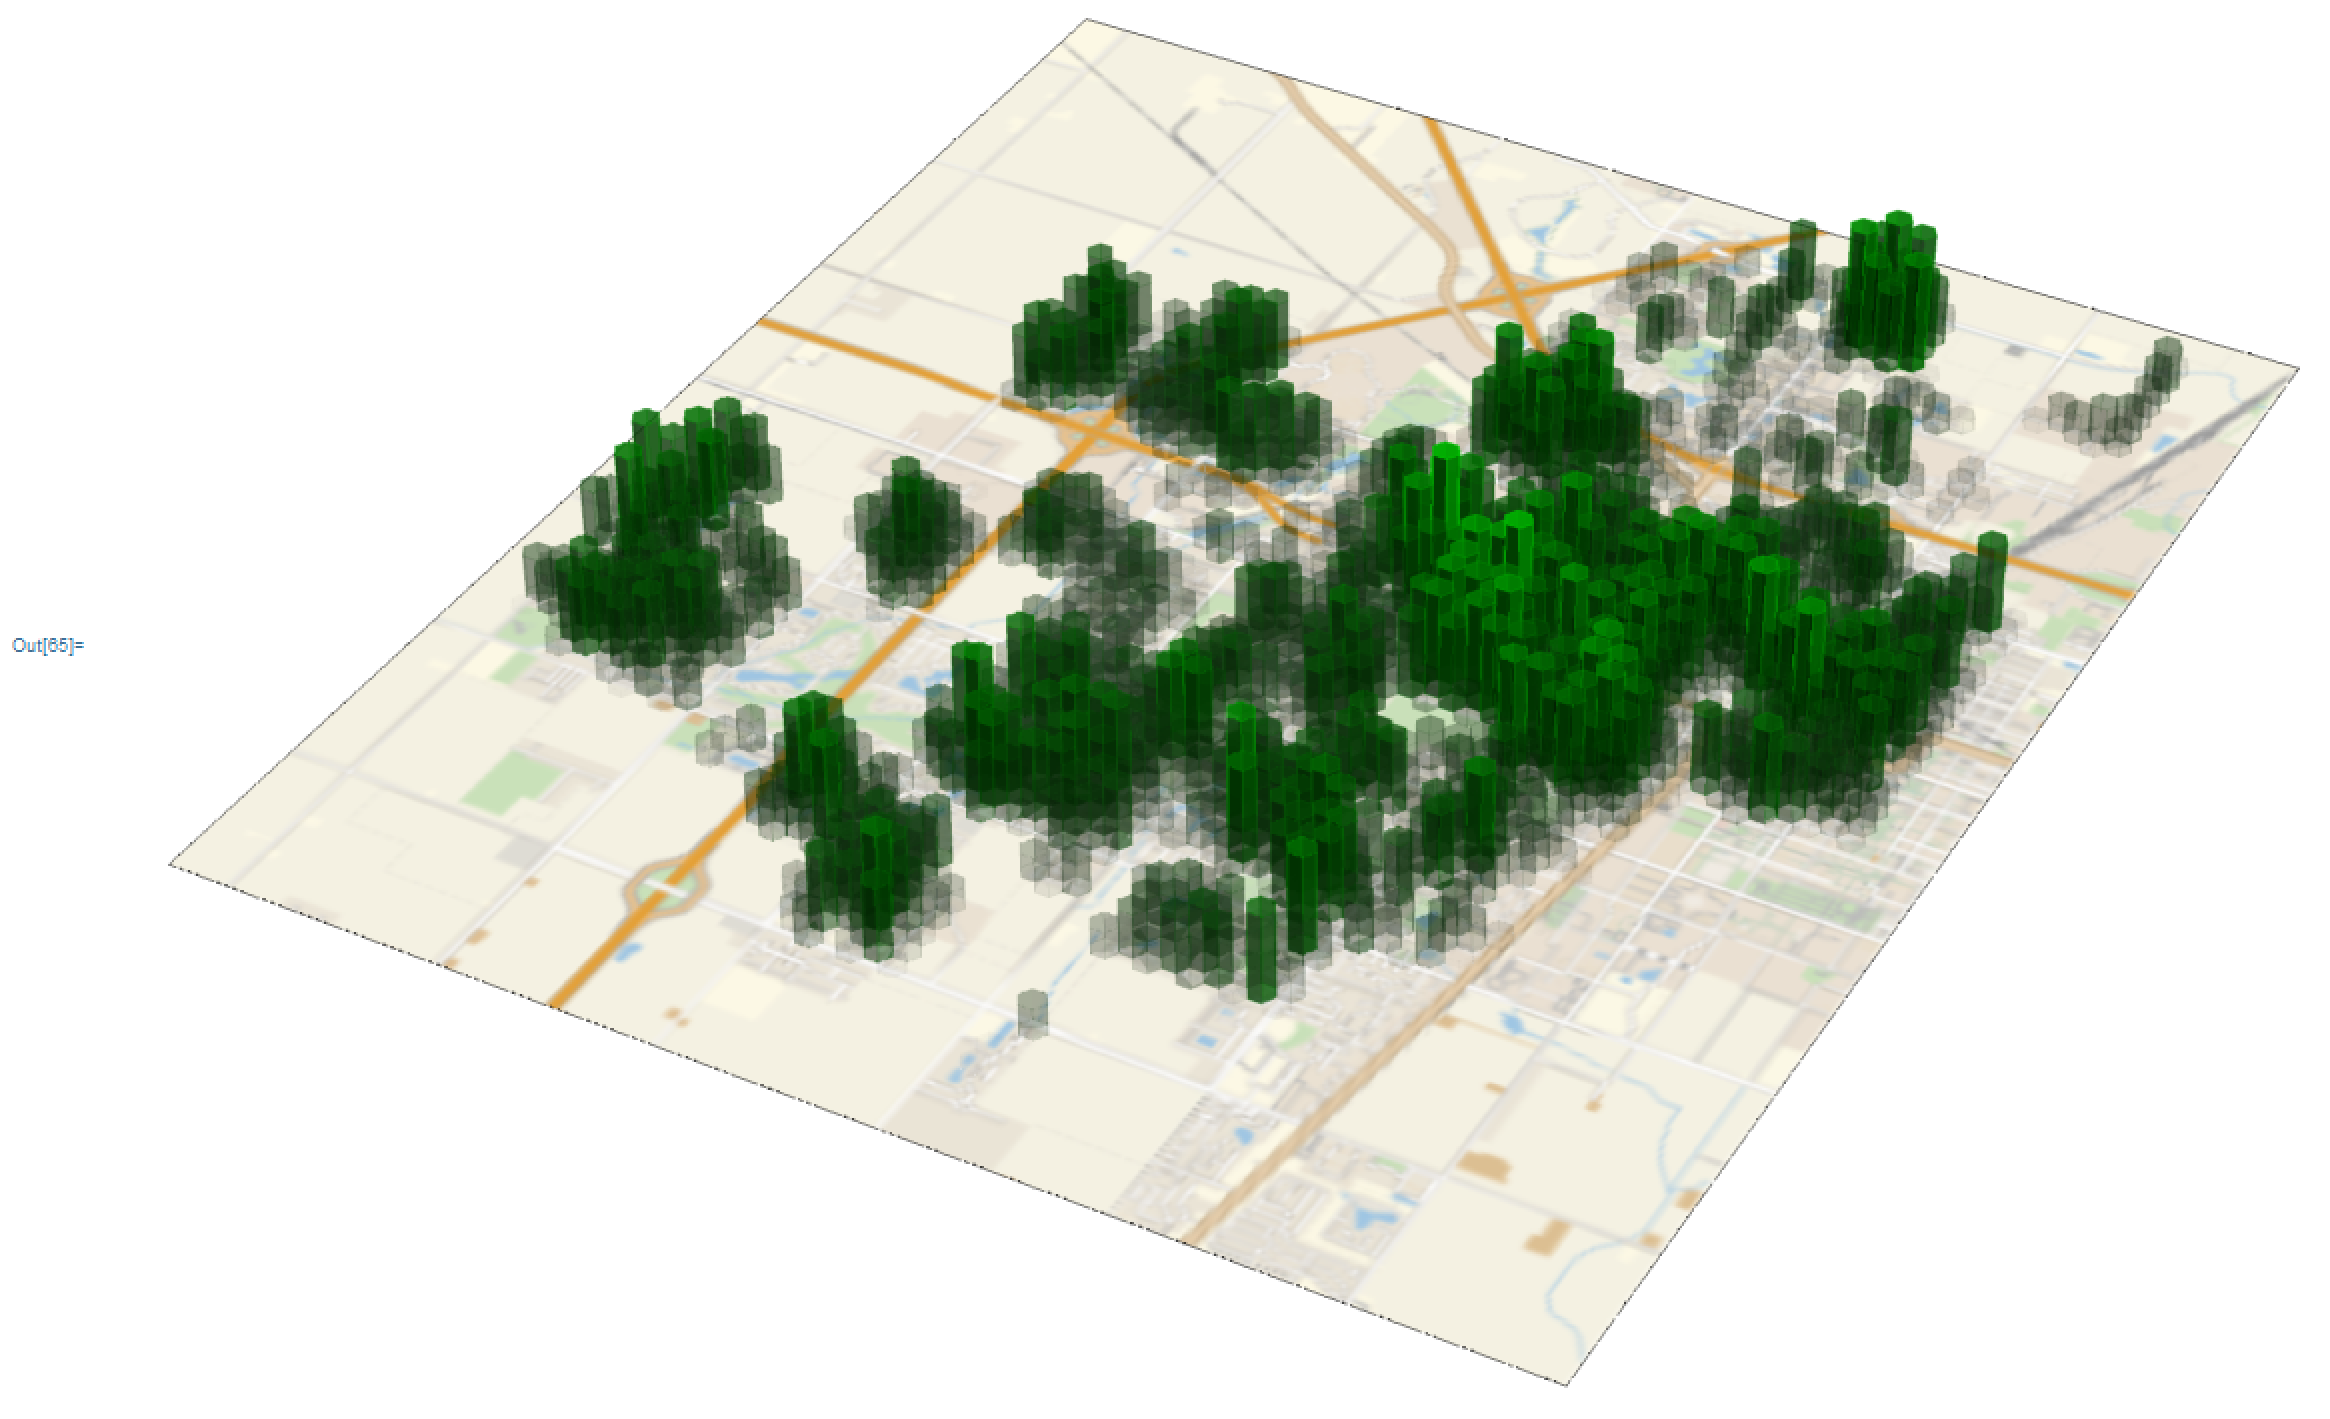
Example 3:
The first figure comes from the documentation for tree coverage in Champaign, IL. It's the last example under the Applications section for GeoHistogram. I admit that I did modify the GeoHistogram3D code slightly, in that I added EdgeForm and FaceForm to be the same as the ColorFunction:
...
{color, EdgeForm[color], FaceForm[color], Polygon@ Join[...]}
...
with the GeoHistogram arguments taken from the documentation, but with more bins:
GeoHistogram3D[trees, 60, ColorFunction -> (RGBColor[0, 0.8 #, 0, 0.9 #] &), {}]


