Message Boards Message Boards

Randomness of the number C[10]!, a candidate for replace Pi (random basis)

Hello people of the community, I'm an enthusiast of Mathematica and Wolfram|Alpha who's been busy for the last few days with a project on possible numerical candidates to be used as random alternative bases for various applications. As I know there are amazing mathematical friends in the community, I decided to humbly expose my work and ask about opinions, etc. Only for the purpose of presenting some of my ideas and also to start an informal discussion on this kind of subject: number randomness. And maybe it can also be useful for someone here.

To begin with, I understand that the randomness that I speak in this text is not truly random, but it serves as the basis for almost-random operations and distributions that need that specific degree of trust.

In order to study the randomness of the transcendental numbers, candidates for transcendental and notable irrational numbers, I used a table base and developed a digit counting workbook. I only used numbers with 10000 decimal digits for the study (generated using Mathematica and the data later adapted to data workbook). Below is the example of the interface I used with the Pi number:

enter image description here

Each workbook of data like this above is a point on a chart, that is, many similar to this will result in the characteristic curve of each number review. In this study I compared four different specific characteristics (Y-axis). Using the workbook I could detail these quantities as the digits increased to 10000 on the X-axis. I used the transcendental number Pi to start the study. In this study I made my own version of properties to study the numbers and are not necessarily the conventional way of doing it. Given:

C = Deviation of the average arithmetic between all the decimal digits in the range.

S = Deviation of the average count of different digits: how many nine, how many 8 etc...

T = It measures the difference of how many numbers are between 0 and 4 in contrast to those between 5 and 9, such as a coin toss, result between rounding up or down situations.

A = Total number of digits forming or part of doubles, triples, etc.: 11,222,5555, 333333333... (in the interval studied).

I've tested several numbers and their combinations. As for example: E^Pi, Pi^E, E^sqrt(2), 2^sqrt(2), Zeta (3), Gamma(1/3), Ln(2), Ln(Pi), E^(1/Pi), E+Pi, GoldenRatio, EulerGamma, E+Ln(2)+EulerGamma, etc... around 30 different numbers, preferably transcendentals, irrational and other notorious candidates. There are two types of accuracy in this project, some I made with with 31 data points and some more detailed with 91 data points. Below is the detailed graph of Pi referring to the characteristics already stipulated: enter image description here In this graph each vertical line is one point to the curve and has a separation of 110 digits, there are 91 points from 100 to 10000 digits on the X-axis. Below are a few more examples with other notable numbers:

E Number enter image description here Gamma(1/3) Number enter image description here Ln(2) Number enter image description here Each of these charts above have the space between the vertical lines of 330 digits (X-axis) and use 31 points between 100 and 10000. They represent the characteristic curve of each number (Y-axis). Note 1: Realize that the closer to the X-axis are the curves, in all graphics, the more well distributed and favored is the number for its use in random applications.

Then the following: I calculated the AREA below the curve in the graphs to characterize each of its value. The method I used was to calculate the area through average trapezoids formed by the arithmetic mean, so consequently I considered its own degree of precision. Note 2: The important point in this study IS NOT the absolute values that I found (because I used a specific method), BUT the comparison of the values between the different numbers, since I used the same process in all objects of study, making it possible to compare. Below is the table for four important numbers using the accuracy of 31 points.

enter image description here

The Pi number has the lowest frequency to form repetitions of ALL the numbers tested (..would that be the manifestation of it irrationality?). Well, after a sequence of tests and more tests, in this quest to find candidates equal or almost good as Pi in this characteristic, I found by chance a very good candidate number: the number C (10)! , or ChampernowneNumber(10)! (! = factorial): I used Mathematica to generate the test numbers (examples): enter image description here In this example above are the first 500 digits of the numbers C(10) and C(10)!, but in the real study I used 10000 digits (also generated by Mathematica). Examples of digit count according to the amount of total digits. The left is the C (10)! And the right is Pi: enter image description here Below is the result of the workbook I generated for the C (10)! using 31 points of precision: enter image description here

Full chart of Champernowne (10)! (now with 91 points, 110 in 110 digits, 100 to 10000): enter image description here enter image description here

Comparing the data I got for Pi e C(10)! numbers (max accuracy, chart of 91 points): enter image description here

I conclude that: of all the numbers tested (transcendental, irrational, etc.) the number that has the characteristic of not-repeating-numeral to those of Pi is the ChampernowneNumber (10)! : a possible candidate to replace it in applications that need randomness and it IS NOT possible or convenient to incorporate Pi (is that a best alternative candidate? ). Currently I take 2 minutes to do a fast previous checkup on any number with the workbook, 1 hour to create and analyze completely with the chart 31 points and 3 hours for the chart of 91 points. Please if you liked the work I did let me know giving a LIKE

POSTED BY: Claudio Chaib
16 Replies

A study on: improving the randomness of Pi

Many thanks to all those responsible for the development of Mathematica, because ALL (100.00%) numbers in this study were generated by Mathematica.

This study is the consequence of the previous reply , where I show the development of the Workbook used (Workbook 4.0 – four (4) workbooks synchronized and linked, 500 points, " noise free ", 10000 digits number) and I acquired a database with 114 notorious and exotic numbers. All numbers were checked with 500 points of resolution and 10,000 digits.

Here, in this study, I collected data on the “randomness” generated from the interactions between Pi and another transcendental number (Champernowne type), first with Singular Interaction (20 samples), then with Compound Interaction (400 samples). With these Synthetic Random Numbers (the ones that were built for the sole purpose to have the best random performance) I expected to get interesting results regarding the behavior of how random varies after interactions between the two target transcendental numbers.

(Objectives):

  • Find a number with the performance of randomness greater than all other numbers.

  • Test which type of interaction is the best to be done between two transcendental numbers to increase randomness in the result. In this study I compared Sum and Product interactions.

(Method):

The transcendental number I chose to interact with Pi was the transcendental number series: ChampernowneNumbers(x), since this particular series had good results for randomness and because we can vary the X to have more samples in the result. In this study I used the X from 2 to 11.

I do this study in two ways: Singular Interaction (20 samples) and Compound Interaction (400 samples).

(Singular Interaction):

The Singular Interaction is of the type:

enter image description here

This is the following result:

enter image description here

The following charts (20 Singular Interaction) to get an idea of the data acquired:

enter image description here

Now the best ranking of the characteristic “A” in Singular Interaction:

enter image description here

(Partial Conclusion):

Use: 20 samples. None of the numbers in this Singular Interaction performed better than the performance of Pi on all attributes. No number had the characteristic A smaller than that of Pi. Only two candidates obtained good and balanced performances despite characteristic A more than Pi: C3-M and C7-M. It was not possible to see differences between Sum and Product operations between these two transcendental numbers because there was little sampling in this Singular Interaction.

In the next type of interaction below we will explore more systematically the operations (Compound Interaction).

(Compound Interaction):

The Compound Interaction is of the type:

enter image description here

The first term is the “shifting number” and varying as:

enter image description here

In this type of interaction the result was systematically explored among 400 sample numbers. 200 with Sum operation and 200 with Product operation. The result is as follows.

These are the numbers tested (just so we can get an idea of the data):

enter image description here

Partial result table of Product interaction with Pi:

enter image description here

Partial result table of Sum interaction with Pi:

enter image description here

Analysis of the numbers found, Sum and Product, comparing with Pi and ChampernowneNumber(10)! (which was the previous “star”):

enter image description here

(Conclusion):

Best Synthetic Random Numbers I get:

I can classify the result of the best random numbers found as follows:

  • C(10)! type efficiency (light blue in chart above): Candidates similar or better than ChampernowneNumber(10)! performance (the previous "star"), there are 5: 1 found by Product and 4 found by Sum. The numbers: C7-2a2, C2-7b1, C7-2b2, C8-5a2 and C10-4b2. They are very good candidates, like C(10)!

  • Super-Candidates type efficiency (purple in chart above): Candidates that exhibit super-efficiency of randomness. There are only 2, found by Product. The super-candidates are:

C5-8a1 (second best)

C5-2a1 (best of ALL)

enter image description here

enter image description here

This number C5-2a1 is the best number among the 534 numbers of my database joining the two posts: among which many of them are Notorious, Exotic, Champernowne Series and Synthetic Random Numbers.

enter image description here

Three numbers: C8-1a2, C7-6b1 and C10-4b1 surpassed E^(1/Pi) in characteristic "A" ! But they are not very balanced in other features.

Finally, a concrete result was found to improve Pi's randomness in these two super candidates!

The use of this Synthetic Random Number super-candidate ranges from simulations to dice apps and random number generators.

Best Operation:

Exact 100 Compound Interaction numbers are better than Pi in C, S and T simultaneously, 52 by Product and 48 by Sum, another 300 are worse than Pi. Although only 11 numbers found have the characteristic “A” better than Pi, Pi has median characteristics C,S,T in comparison to this type of number analysed.

enter image description here

We can conclude that it is INCONCLUSIVE what kind of operation is best to increase randomness by interacting two transcendental numbers, since both Sum and Product gave results without any tendency or visible improvement, only average non-favorable results and some optimal peaks as expected. This is interesting to me particularly since I thought that Sum would give better results by adding a well-distributed rational part of digits to the target numbers. But both ways gave similar results. Even with these 400 samples it remains inconclusive whether it is better to improve randomness with Sum or Product interactions.

This study took 11 days (4 hours a day) to be performed.

Attached is the full table of the 534 numbers.

Attachments:
POSTED BY: Claudio Chaib

((UPDATE))

I've compiled a new version of the workbook (2.0) for random testing with some upgrades:

  • Now the workbook is completely automatic without human interference (before it was semi-automatic with green color system for checkup, I decided to keep the checkups but everything is automatic).

  • The number of digits remains the same (10000), but the amount of points was 91 to 200 (step 50 to 50 digits).

  • The workbook was singular, now I use 2 workbooks (the first one generates the data in a table and the second computes the area and generates the chart), because the workbook almost crashes by memory (218MB), so I decided to split in two. More efficient.

  • Before it took 3 hours at 91 points, now I take 15 minutes at 200 points. I can check any number relatively fast!!

  • I fixed the denominations of C, S, T:

C = Used to use the digit 0 as 10, now it's conventional from 0 to 9. It's Fixed.

S = I just subtract the value 1 from the results for more precision.

T = Before I used the digit 0 as 10 and now I use 0 to 9, more conventional. I subtract the value 1 from the result for greater accuracy. It's Fixed.

  • Now all the tested numbers will have the same precision and scale pattern on the charts!

Example version 2.0 interface: enter image description here

New Pi graph with new version of workbook (50 to 10000 digits, from 50 to 50 in vertical lines spacing (X-axis), 200 points): enter image description here

... I will be re-checking the numbers and post the new results and many more notorious numbers´s charts here soon!!

POSTED BY: Claudio Chaib

((RELEASE 3, Complete – Charts and Data Analysis))

In this new Release 3 I compiled 26 more numbers with the workbook 2.0 (3.0 is coming…):

-a few more notable numbers.

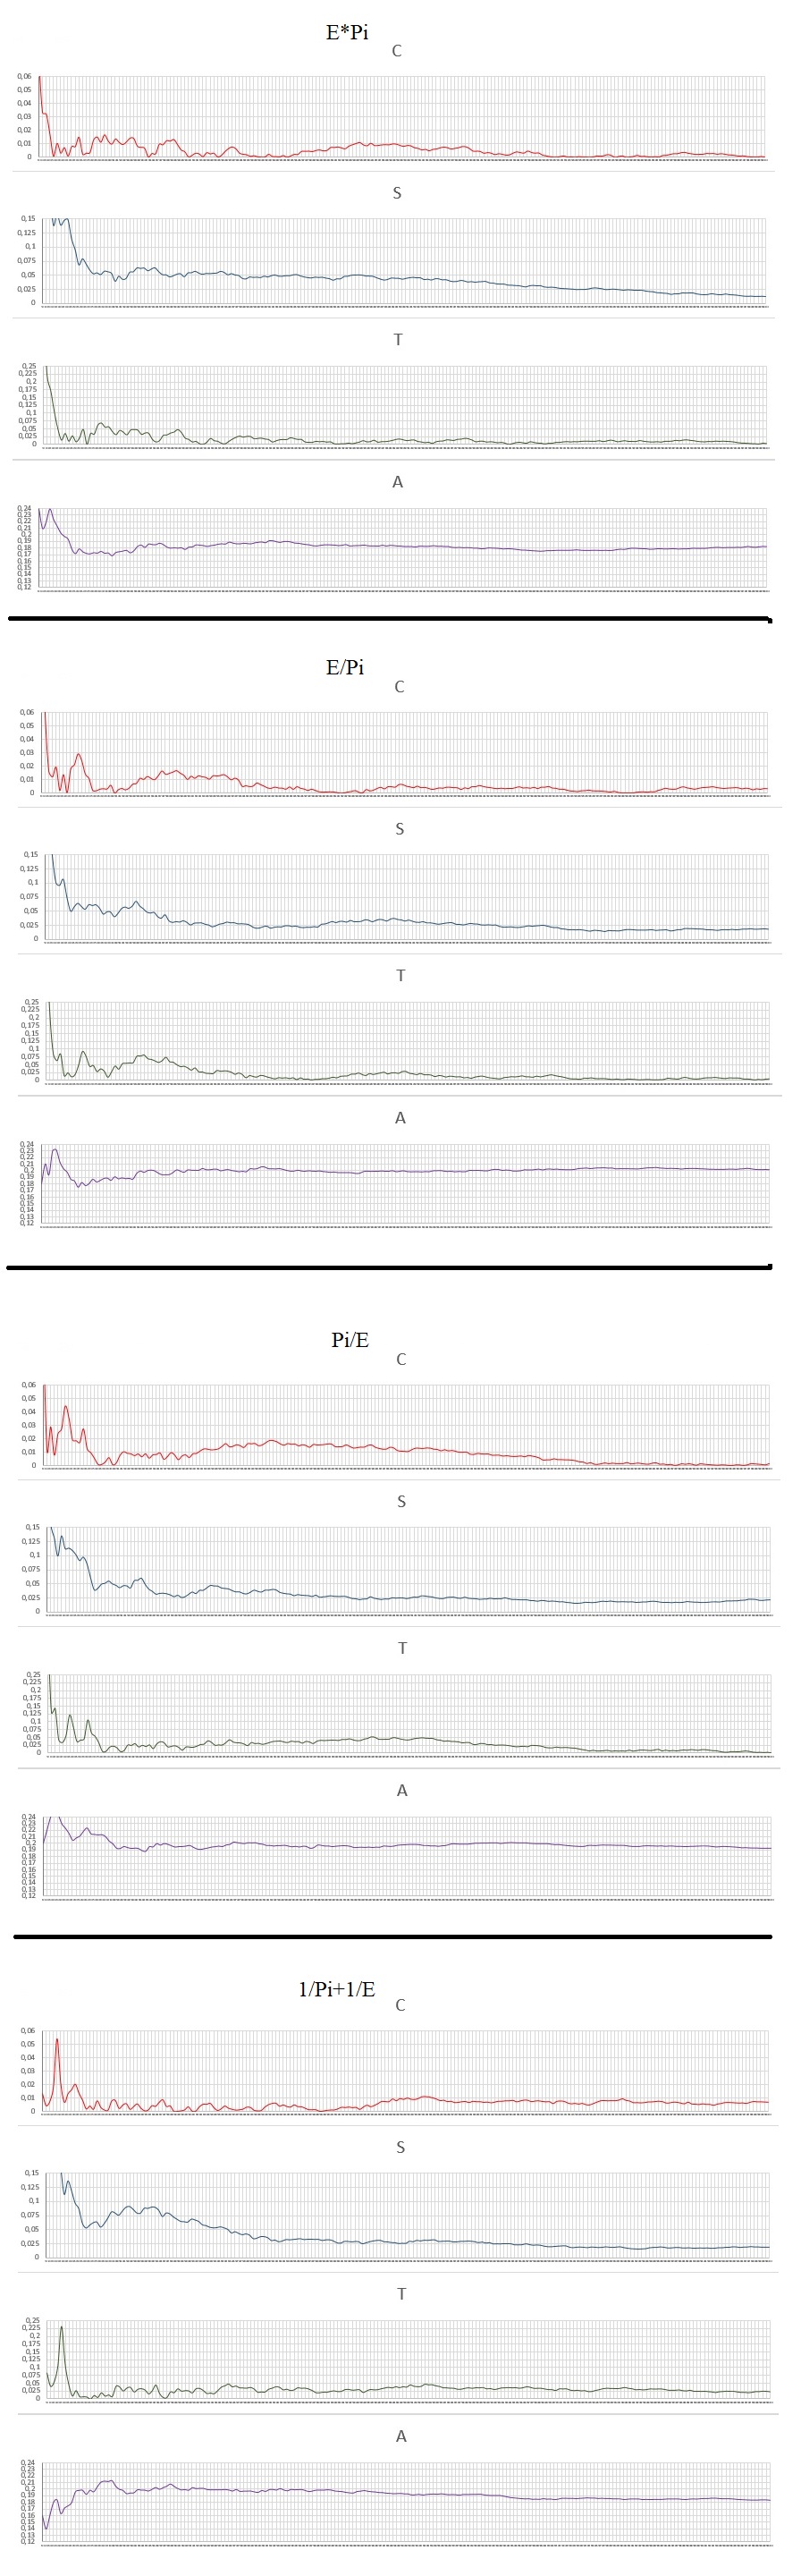
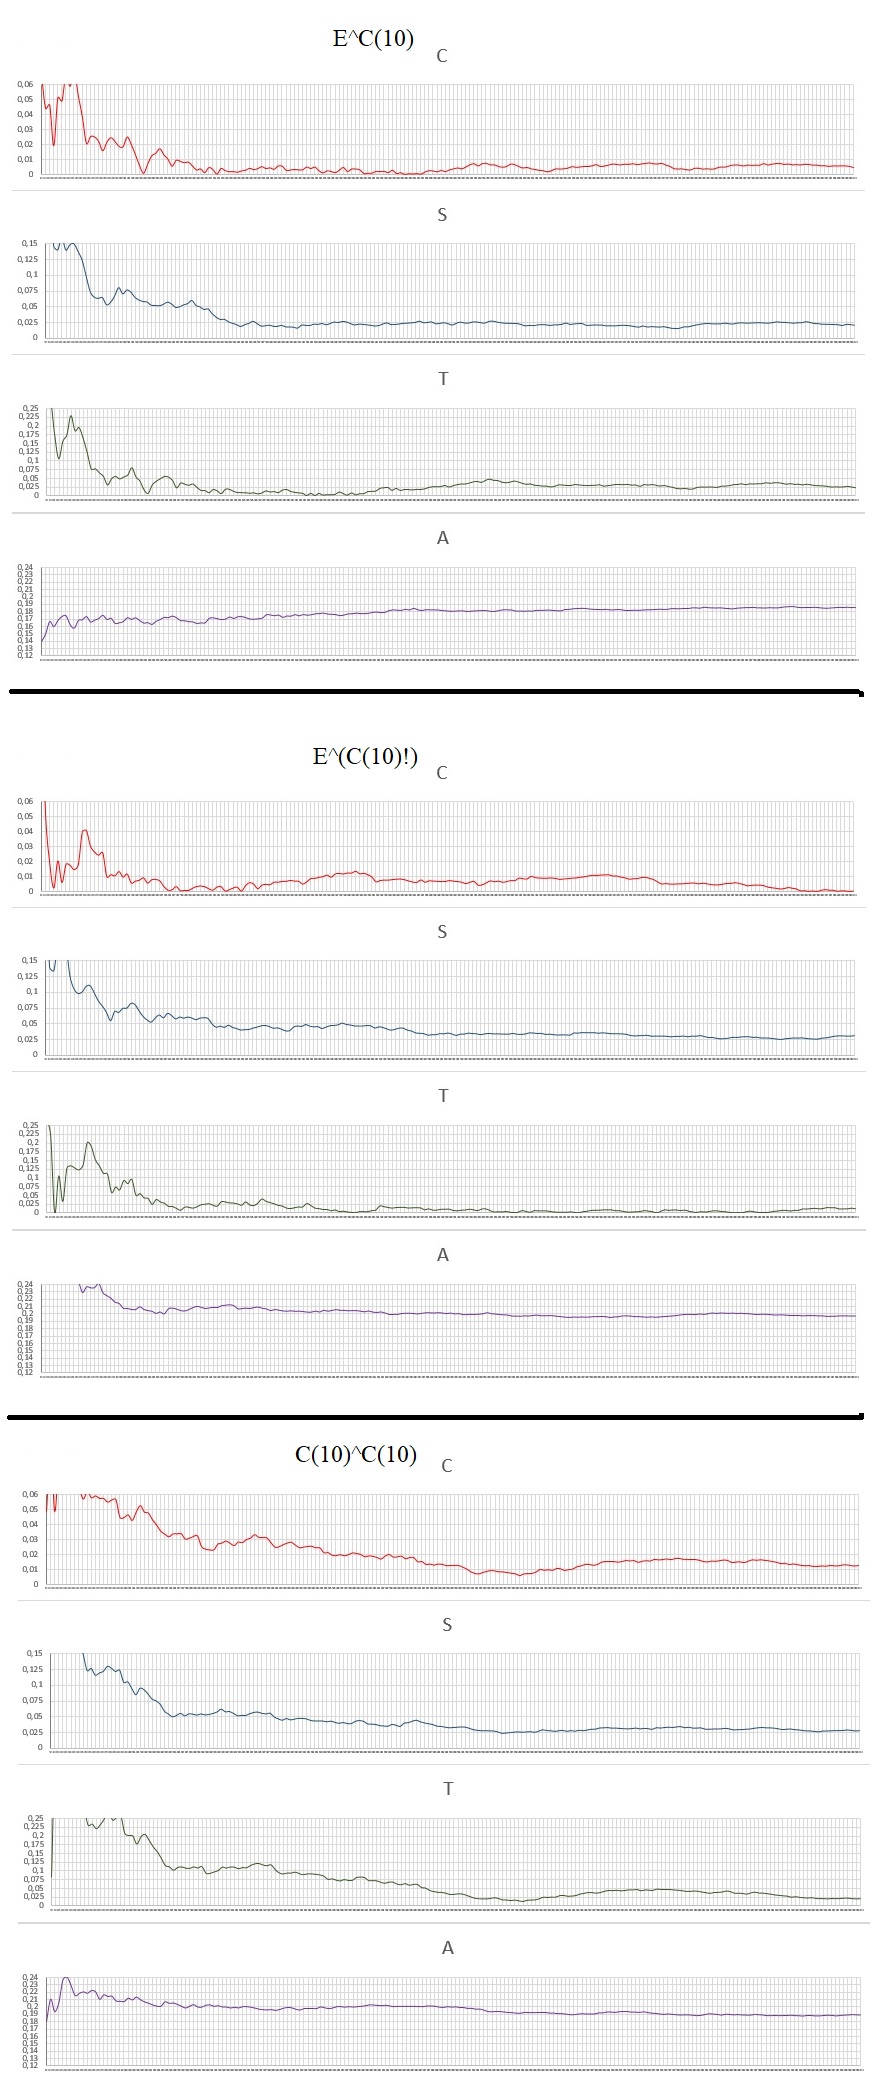
-more numbers generated from the series of interactions between Pi and E.

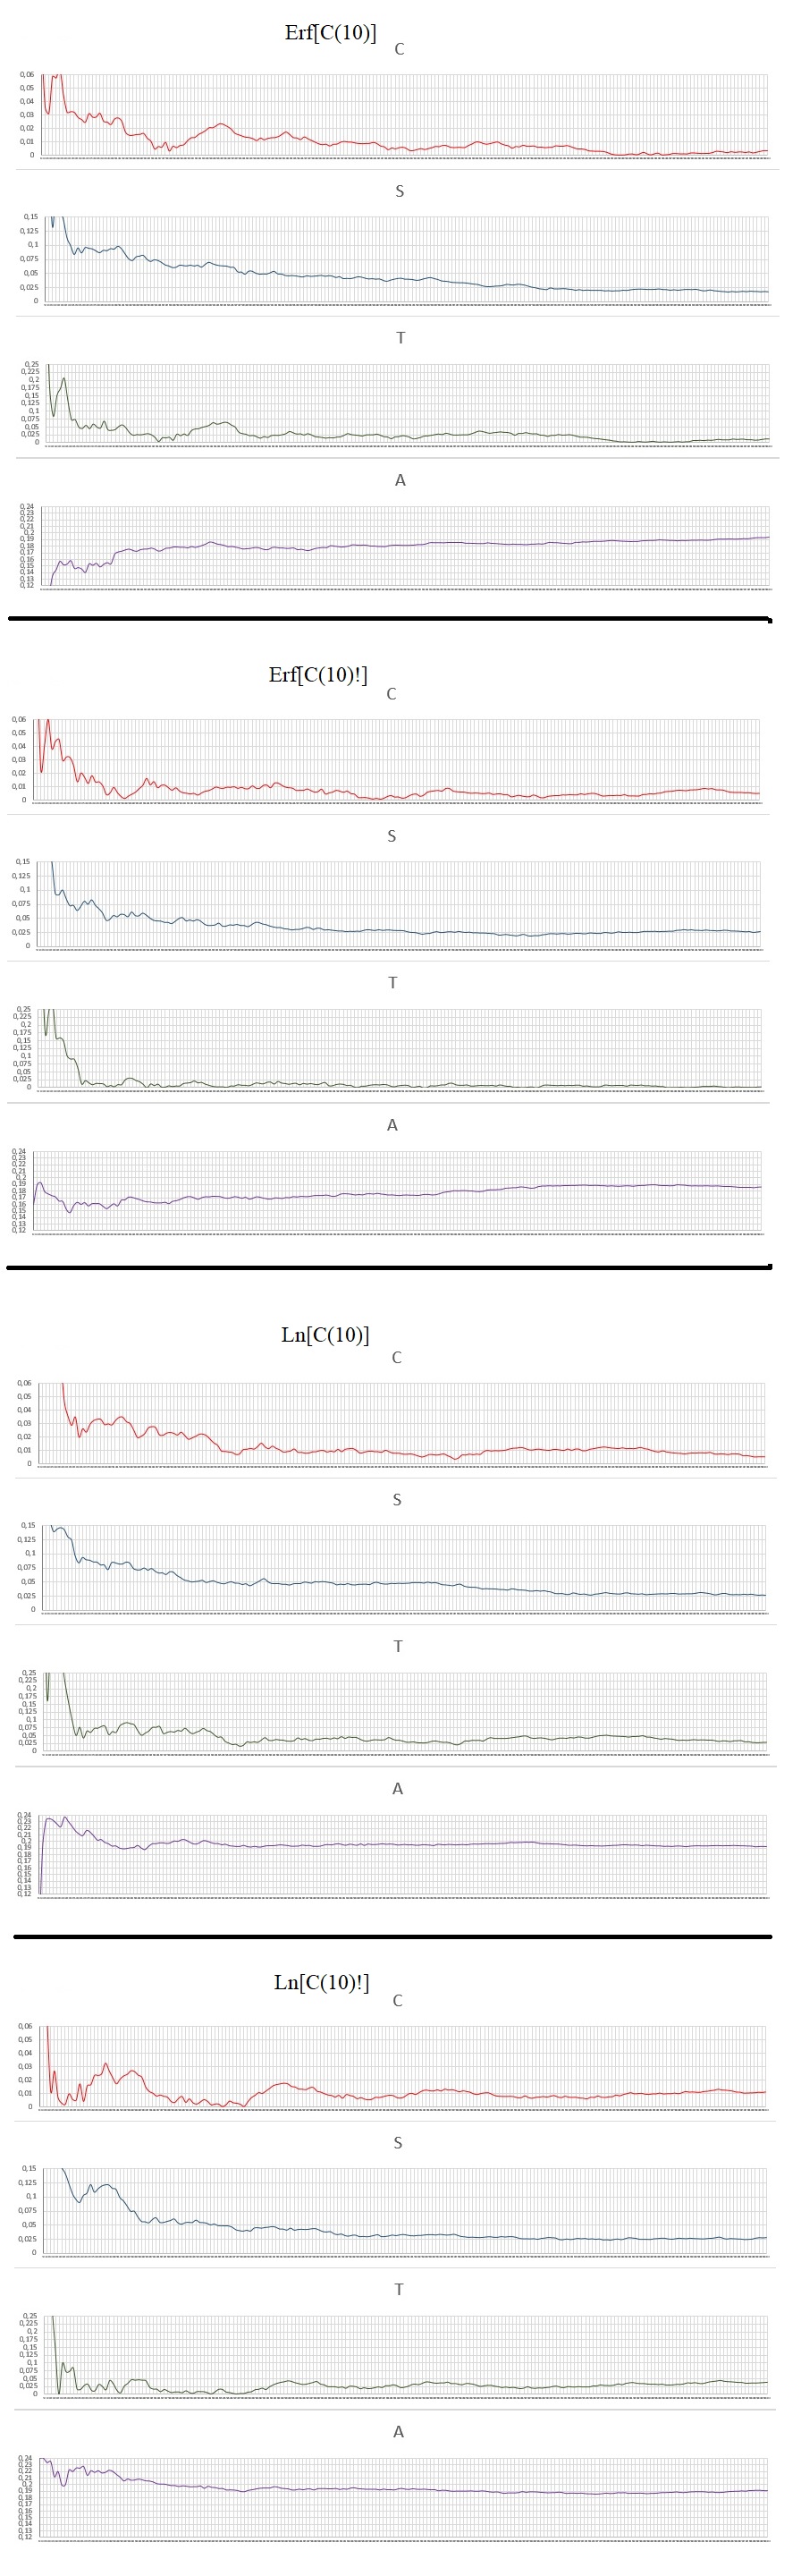
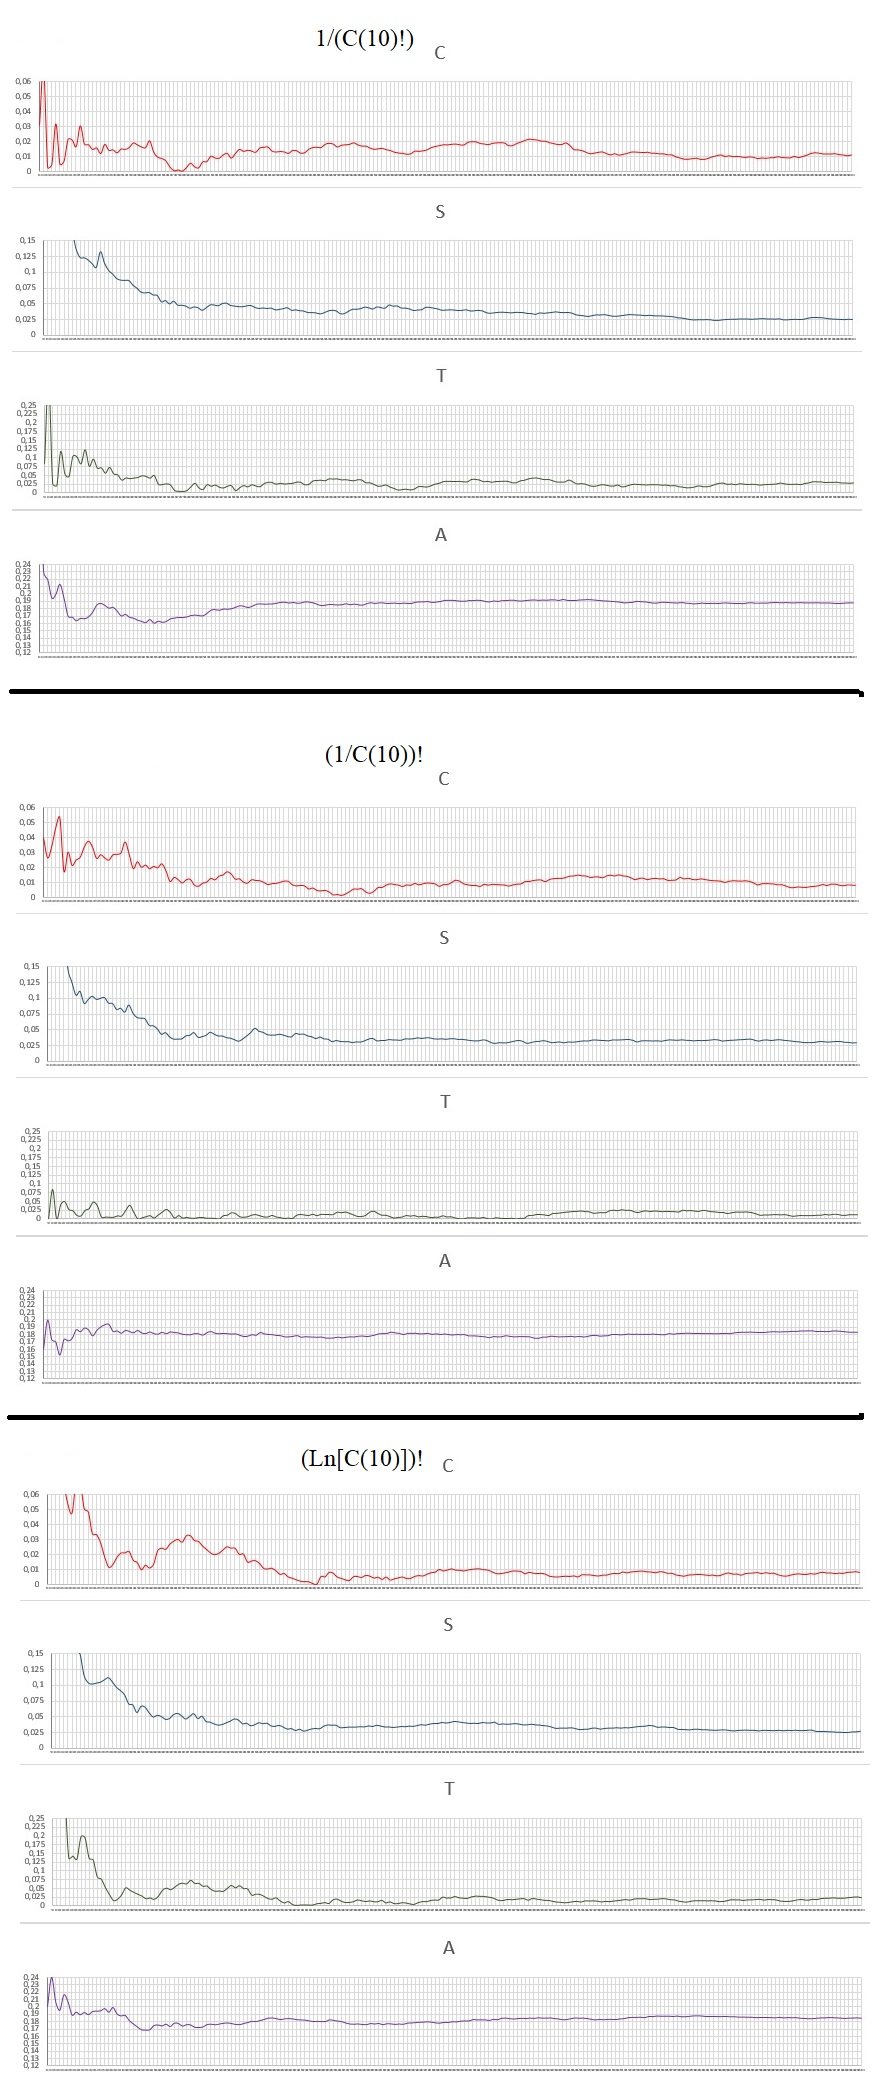
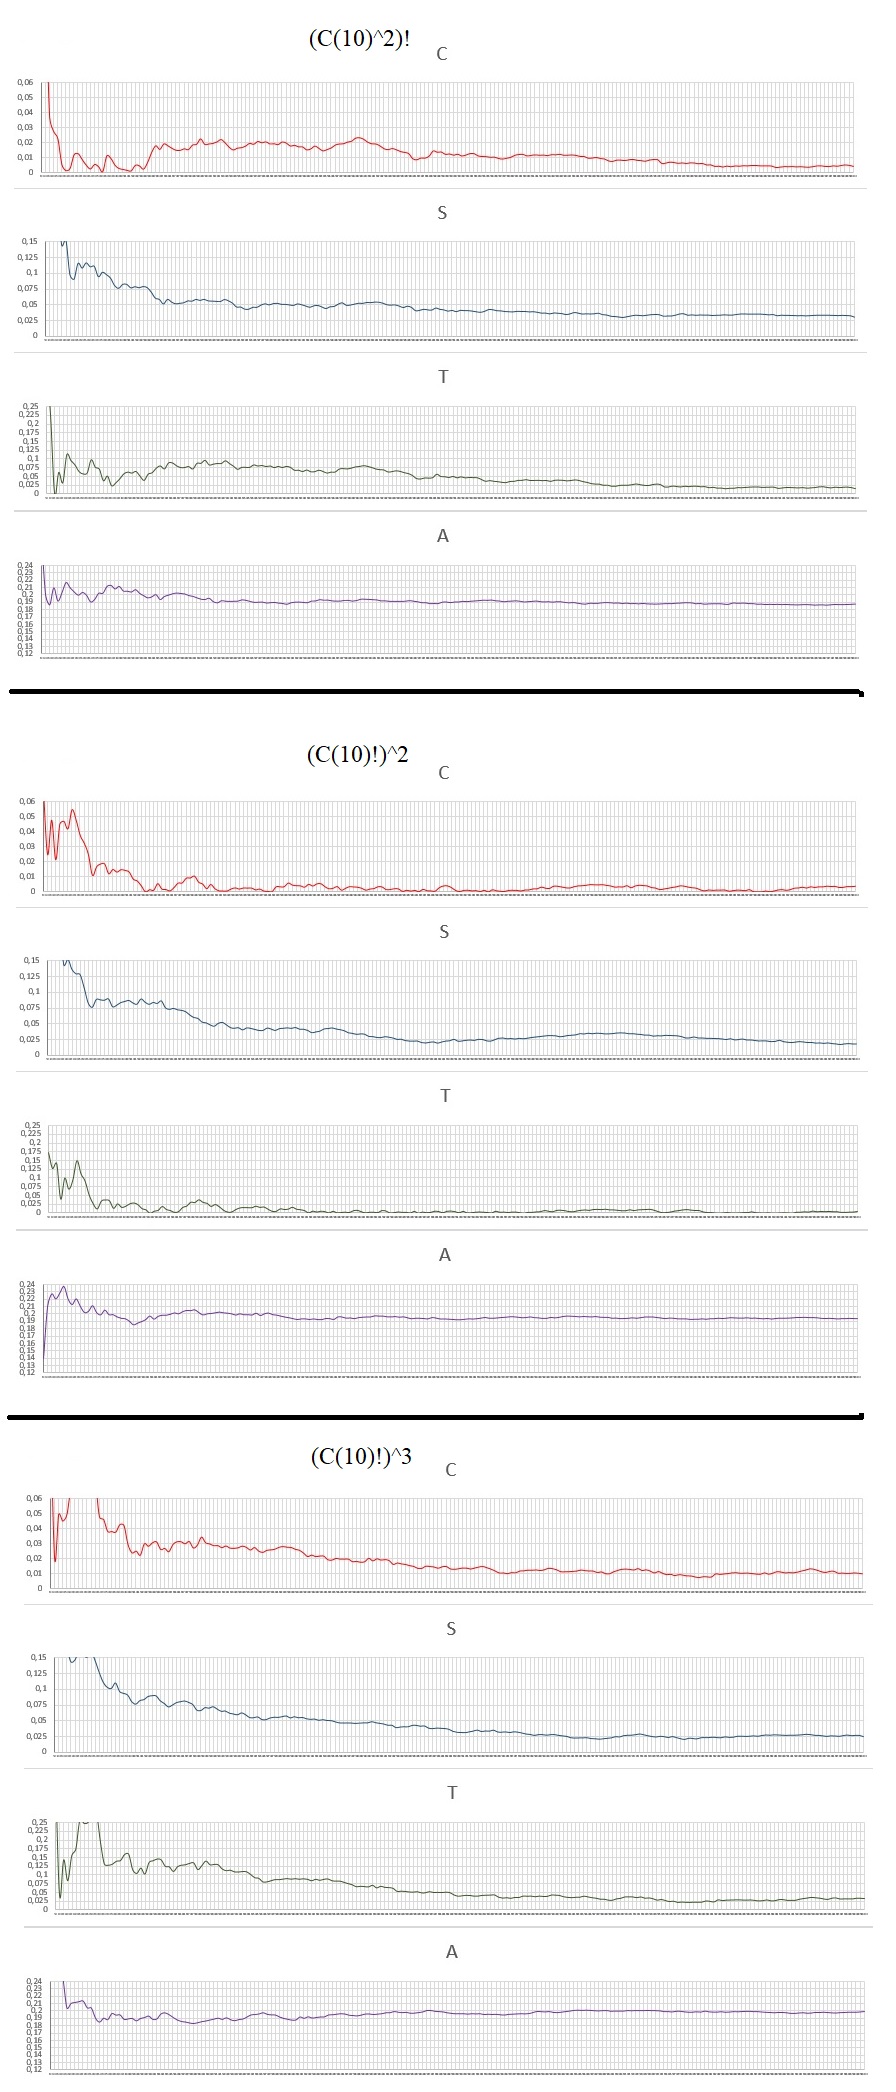
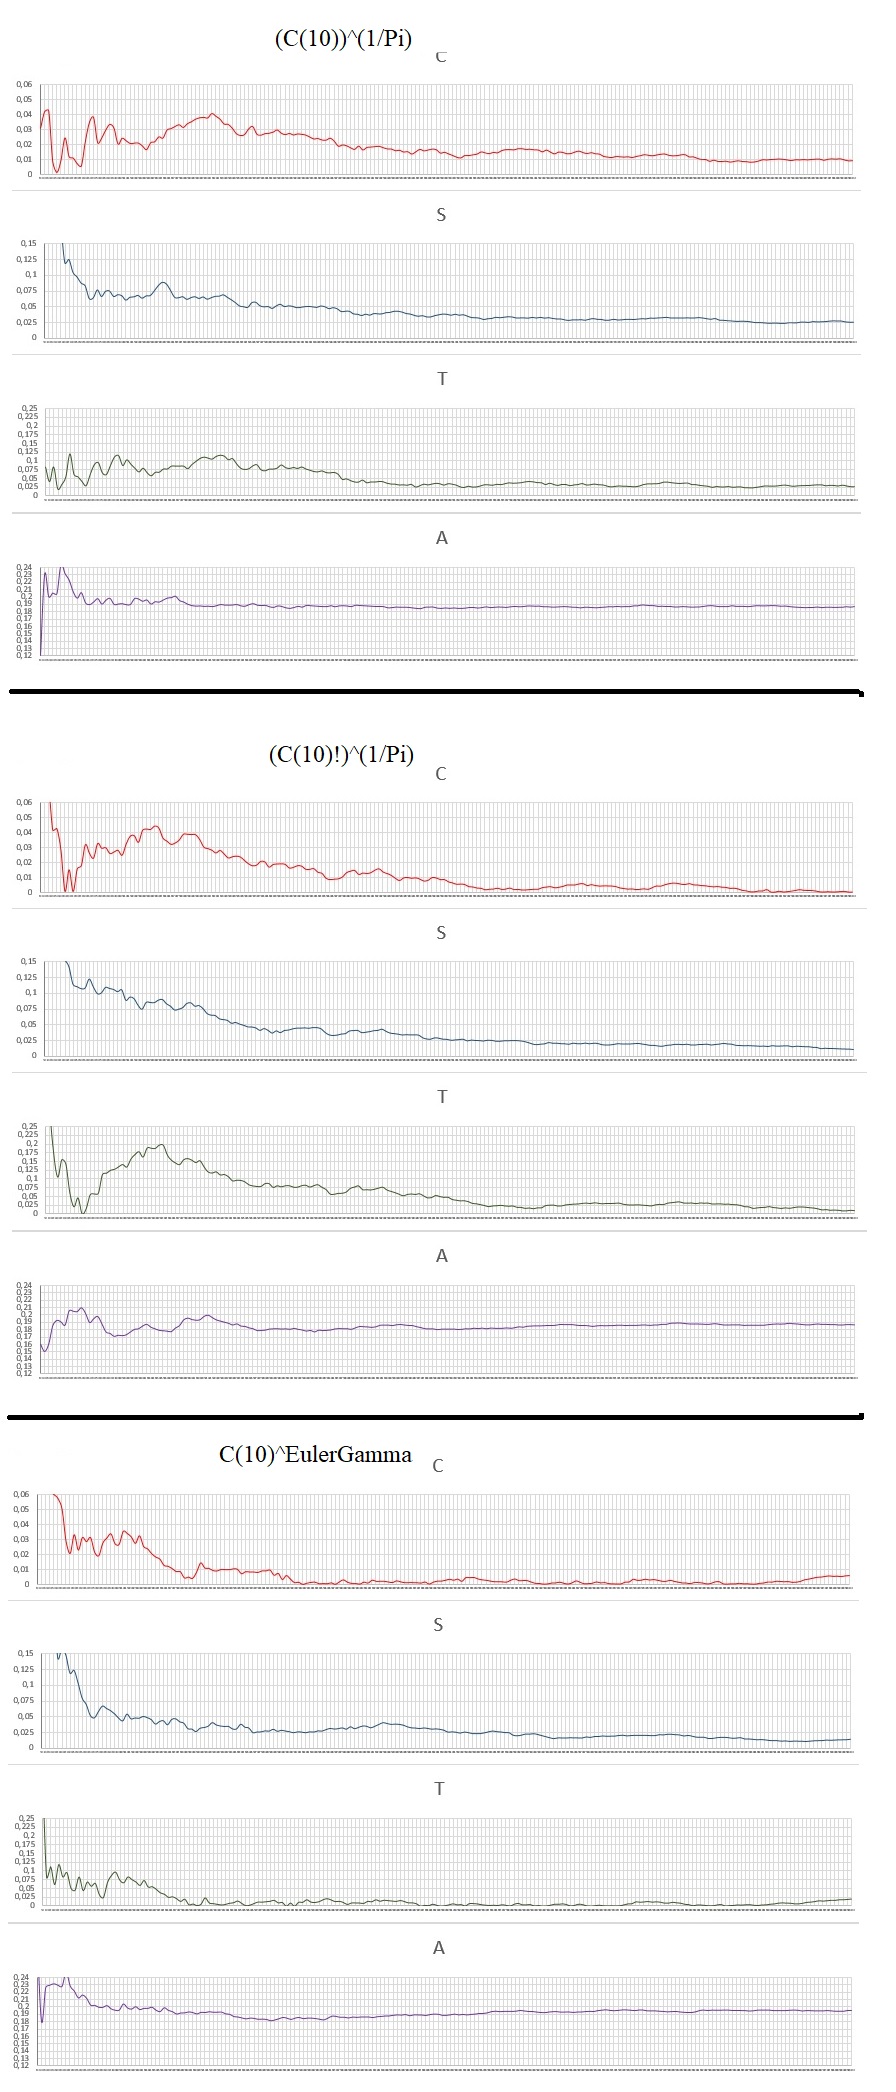
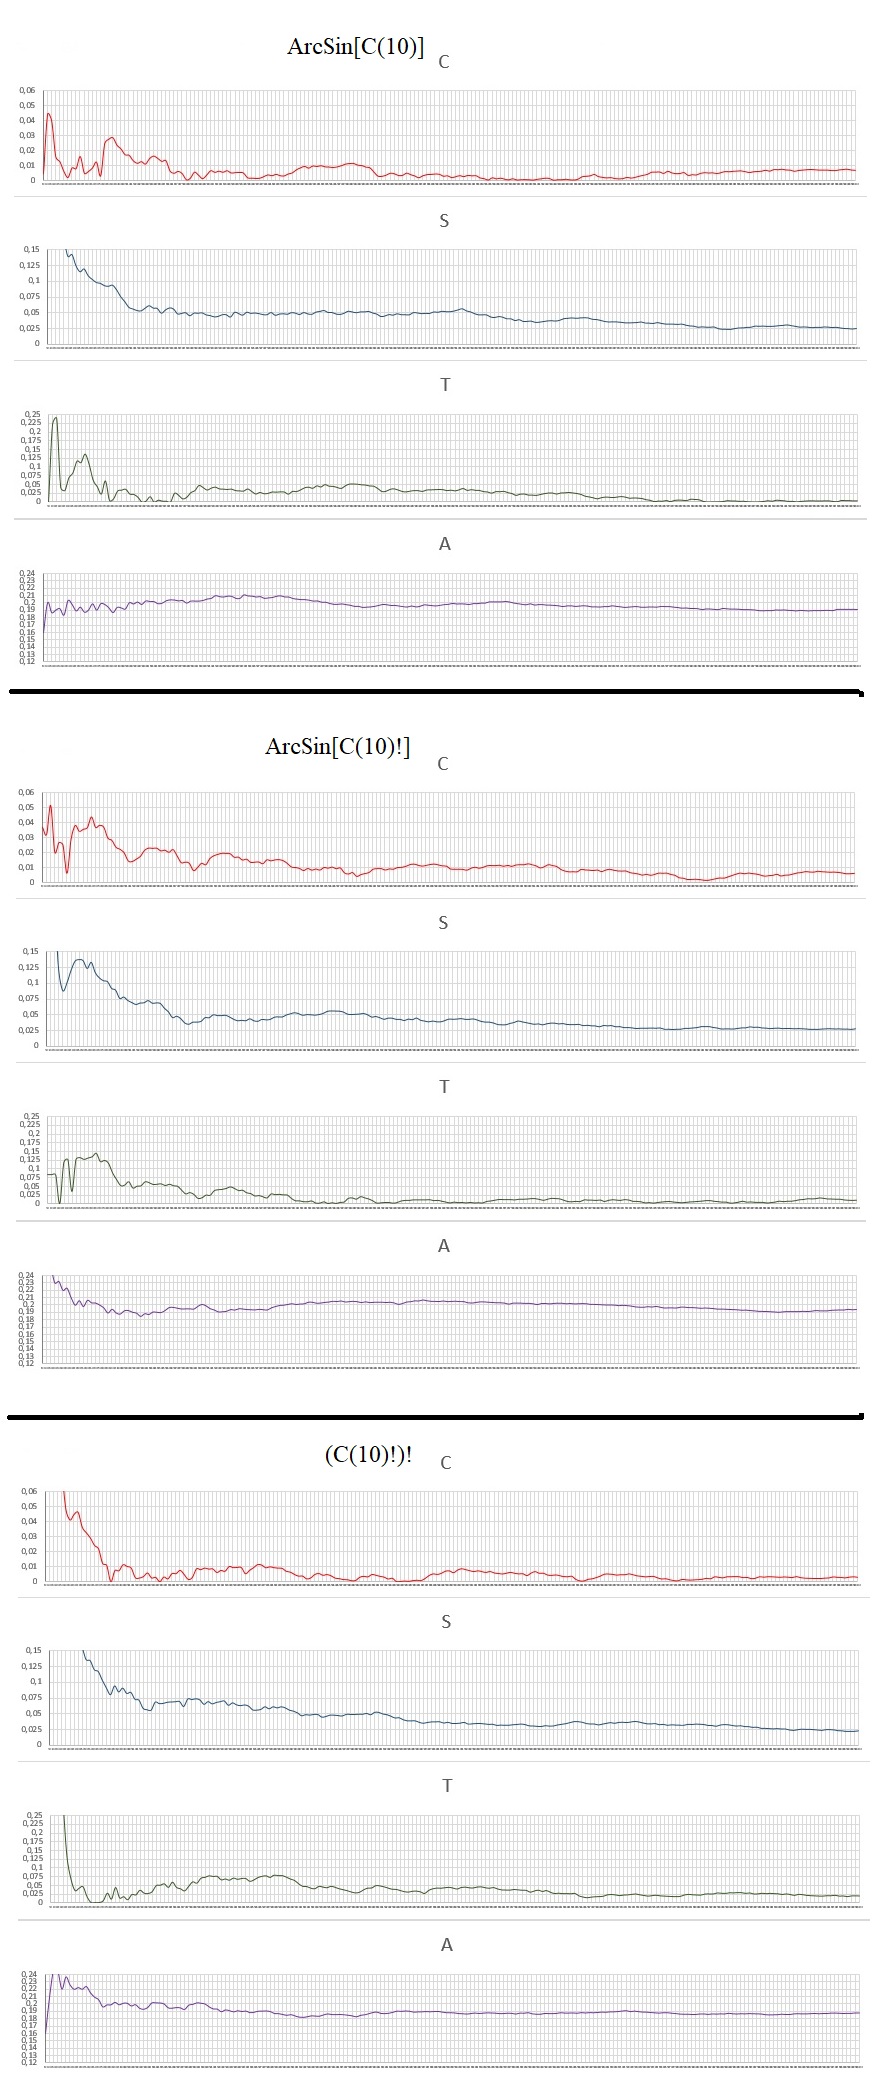
-some exotic numbers from C(10) and C(10)!

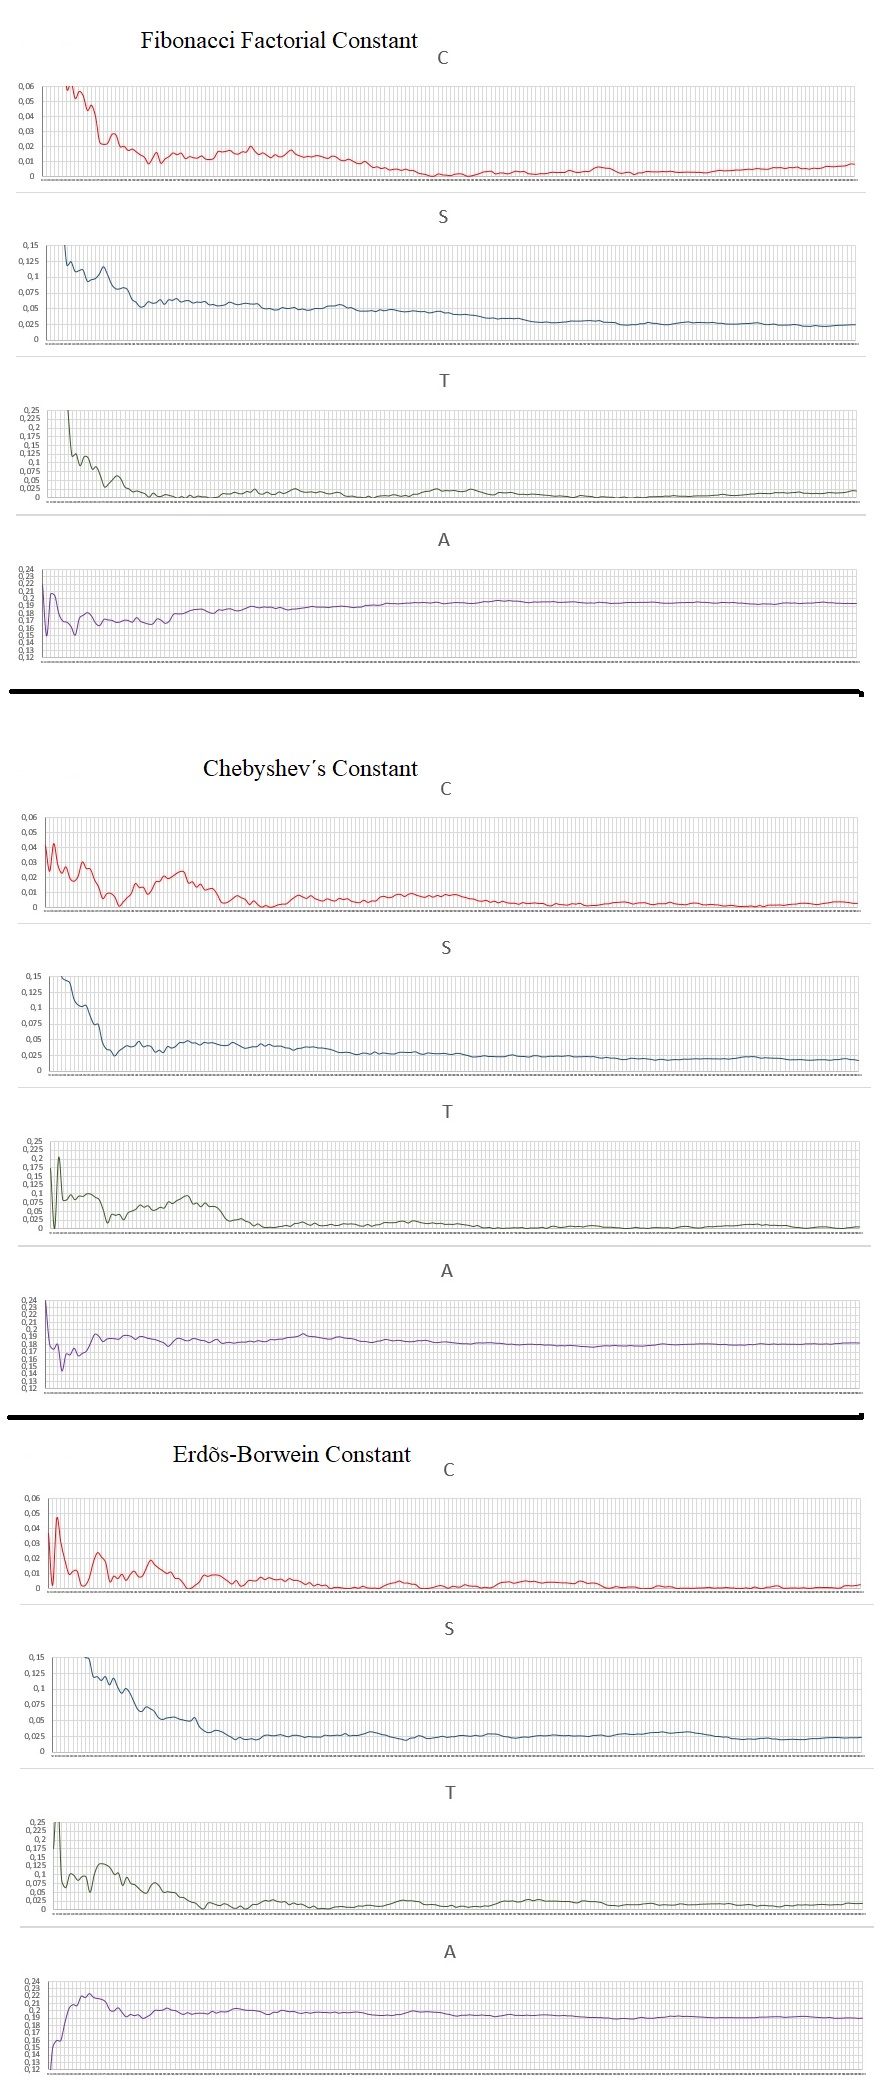
EXPLAINING: C, S, T, A

(C): Deviation of the arithmetic mean.

Given the raw sum of all the digits divided by the total amount of digits: M

If M>4.5, C = M/4.5-1

If M<4.5, C = 4.5/M-1

If M=4.5, C = 0

(S): Deviation of the digit Count.

Given the average number of digits optimal for each digit being equal to the Total digits divided by 10, because there are 10 digits different from 0 to 9.

N = Total of digits/10

So the number of digits lagged for each is given by Dk:

Dk=abs(N-k)/N , k= Total digits for each type: 0.1, 2... etc.

Then I do the arithmetic mean: D0+D1+D2+D3...+D9 = DM, and divide by 10 to do the mean and decrease the scale:

S = DM/10

(T): tendency in a coin toss.

If the digit is 0, 1, 2, 3, 4 is given the value "1". The sum of all "1" = X1

If the digit is 5, 6, 7, 8, 9 is given the value "2". The sum of all "2" = X2

The ratio is made between X1 and X2:

If X1>X2, T = X1/X2-1

If X2>X1, T = X2/X1-1

If X1=X2, T = 0

(A): Reason of repeated numbers appear.

Take the sum of all the numbers that repeat or are part of repeated numbers as in the example: 00,111,222222,55555555, etc. Then it divides by the total digits in the Interval. It's a simple reason.

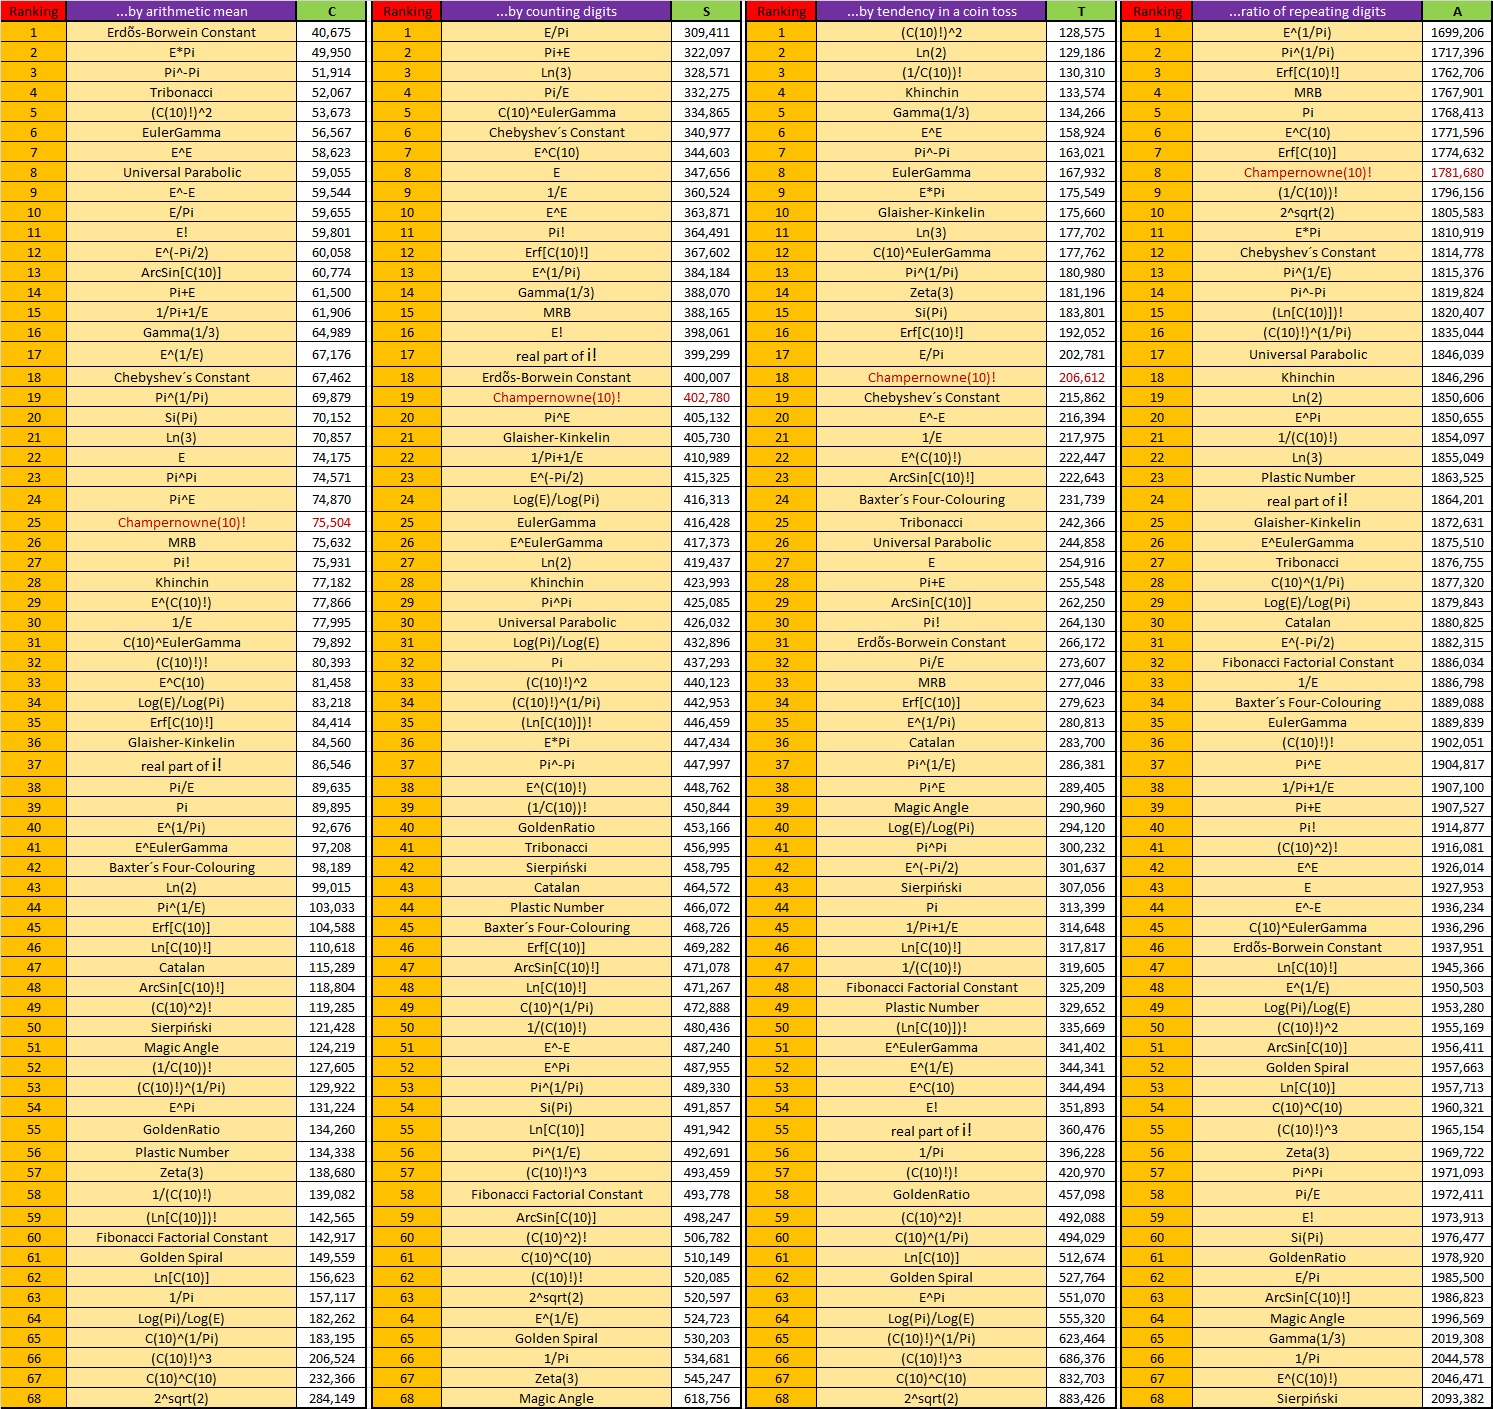
All the numbers analyzed have 10000 digits and each graph a resolution of 200 points with a pass of 50 digits. Here are the charts:

enter image description here

enter image description here

enter image description here

enter image description here

enter image description here

enter image description here

enter image description here

enter image description here

Data Analysis:

Random test of remarkable and exotic numbers.

Number of Numbers: 68

Values: calculated area of the chart, the lower the value, the better for random use.

The result with the values and rankings in each category analyzed:

enter image description here

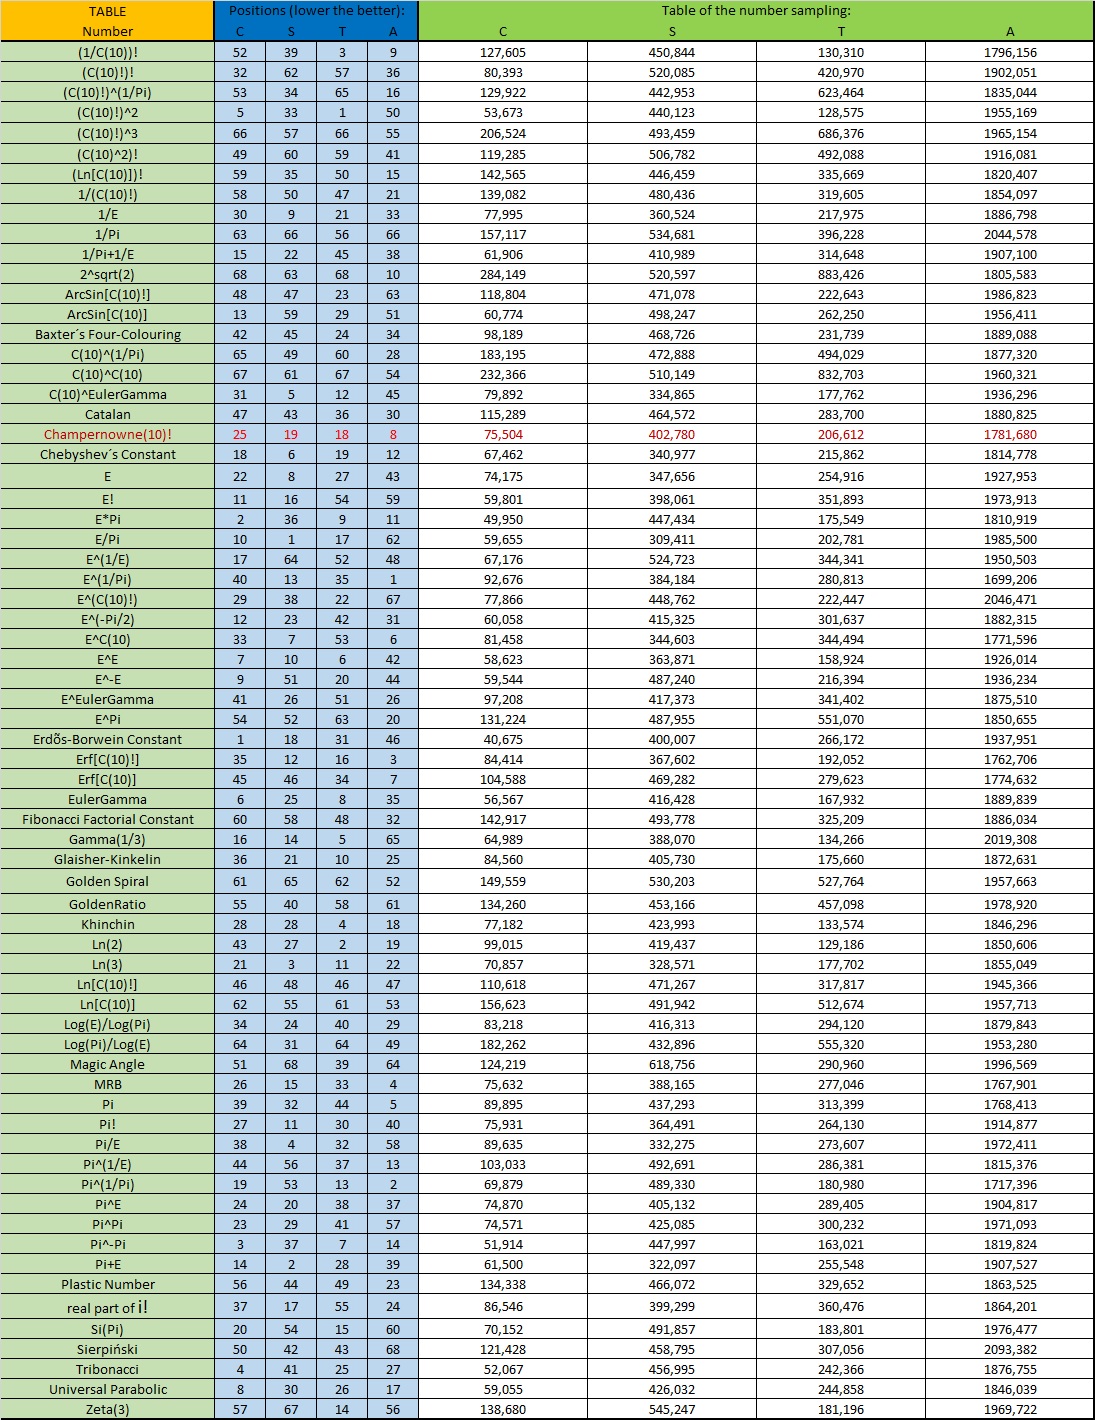
The complete table with the rankings and values of all the numbers analyzed so far (alphabetical order):

enter image description here

Doing an analysis of the numbers with the characteristic A with values close to Pi:

enter image description here

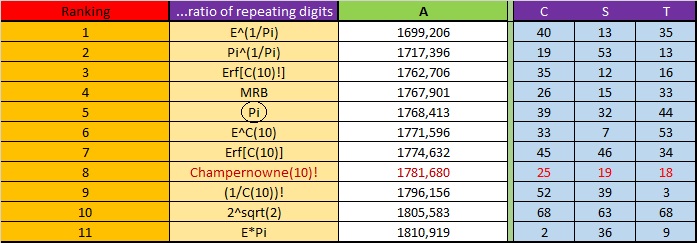
Note that of these numbers above, the most balanced-efficient is still the C (10)! At least for now it is still the best for generic random uses.

In these tests I completed almost completely the simple interactions of Pi and E so that it is possible to analyze how the random behavior changes with each Operation. I was also able to explore exotic numbers in the search for the perfect candidate for use with Randomness.

If anyone has a number or type of number for which I test and sort let me know by posting here. There´s a lot of data here for anyone to use.

Anyone here in the Community knows how I find or generate the Thue-Morse Constant (decimal form) with 10000 digits please??? I know that more than 3 million digits have already been calculated but I can´t find anywhere.....

POSTED BY: Claudio Chaib

((RELEASE 4 EXTRA, A random study of the numerical series type: ChampernowneNumber(X)!))

First I would like to thank you again, the entire team of Mathematica, all your collaborators and developers. Because without Mathematica I could not generate all the numbers I needed for the realization of this project (99.13% of the numbers analyzed here in this study are thanks to Mathematica). Thank you very much for making this possible!

Why give preference to the C(10)! instead of another C(X)!..??? This is the kind of issue addressed here in this RELEASE 4 EXTRA.

I analyzed the numbers C(X)! Varying the X from 2 to 41, that is, 40 samples!

The COMPLETE result and charts is attached to the file: RandomTestExtra.docx

This analysis is done with the workbook 4.0 High-Definition 500, "Noise free ", with 10000 total digits, pass 20 digits, 500 points.

With the following summarized result:

enter image description here

As a consequence of the results of the study, it is concluded that even among the C(X)! numbers, the C(10)! is the most balanced-balanced number for generic random operations! For now at least.

If anyone has any questions or suggestions, be free to give an opinion here. Remember that all the charts are attached to this post (more than 40 charts).

Thank you very much.

Attachments:
POSTED BY: Claudio Chaib

I like how the MRB constant found a nice place in your study, even though, like me, it is a little unbalanced :)

POSTED BY: Marvin Ray Burns

((RELEASE 2, Part 2 – Conclusion and Data Analysis))

Randomness Test

Test objects: Notorious numbers

Quantity: 42

Below is the ranking of the numbers in each feature (smaller is better):

enter image description here

enter image description here

This is the complete table of numbers with their respective rankings in the analyzed characteristics (alphabetical order):

enter image description here

Now analyzing the numbers that have the characteristic (a) close to Pi or better:

enter image description here

My conclusion is that the number C (10)! It's still the most balanced-efficient for random operations. That conclusion is just for NOW.

Hello community! If in a future Release 3 you want your number to be analyzed by me, the graph and the ranking, post here for me to see (the number should be able to be generated by Mathematica or if you send me 10000 digits).

Thanks.

POSTED BY: Claudio Chaib

((UPDATE – WorkBook: version 4.0 “Noise Free” and RELEASE 4))

Working hard for each RELEASE to have more reliable results!

I developed a new algorithm and consequently a new, more accurate version of the workbook. Version 4.0 (high-definition 500). The resolution is the same as 500 points of the (20-digit step) of version 3.0 but with the ability to calculate the constants with the same time as workbook 2.0! So I got the ability to generate all the graphs with 500 definition points and could re-calculate many of the ones I already posted.

This version 4.0 uses 4 linked and synchronized workbooks:

enter image description here

  • Now with this new lighter algorithm every Point is a PointX4.

Corrected: found a noise in the algorithm of chart A: it affected 1% on the 200-point chart and 2.5% on the 500-point chart. A failure in which one of the pickup types understood absence by digit 0, creating some double. Impossible to fix in previous versions (3.0 or earlier) of the workbook ... I had to create a new algorithm and thus eliminate noise successfully!

To perform the noise test I used variations from the number 9876543210/9999999999 (0.98765432109876543210 ....) to simulate maximum randomness by deceiving the workbook sensors to isolate the noise. See the result of the "noise free" workbook:

enter image description here

The “noise free” Pi graph (high definition 500):

enter image description here

  • Corrected: I now use all the digits of the number, before only the digits to the right of the comma.

  • Fixed: Before using 10000 digits by Mathematica however it rounds the last one, then it generated 10003 and it got the first 10000.

  • Severe correction on the Sierpi?ski chart. It was the only chart that had a defect in previous versions. It is FIXED and this is the high-definition graphic of Sierpi?ski's constant (10,000 total digits, 500 points,"noise free" 20-digit pass):

enter image description here

In this RELEASE I added another 7 notable numbers.

All new GRAPHICS: all 10000 digits, 500 points, "noise free", 20 digit pass; are attached to refill the charts. So everyone can have the individual charts at 500 points as well as the tables. (file: RandomTest.docx )

The numbers I re-analyzed (“noise free” - 500 points) are in green text in the table.

Result in the tables:

enter image description here

enter image description here

Conclusion (analysis of the performances of characteristic A):

Let's analyze the first placed or the numbers close to Pi:

enter image description here

Realize that even after these RELEASE and REVIEWS, the most balanced-efficient candidate for generic random use is the C(10)! (all rated characteristics better than ranking 30... however we will highlight that the numbers MRB and Erf(C(10)!) also have good performances, although unbalanced in some characteristic.

I hope this study is useful to someone!

Thanks

Attachments:
POSTED BY: Claudio Chaib

Hello Marvin, I do not know if I'm the best person to give advice on fame because I'm just a humble math enthusiast :), but what I feel is that you do not have to worry about losing your fame, because for me you already are one of the great mathematicians and has already left your name in the history of mankind, this will never disappear .. and also believe that the less we cares about these things, helps more to have creativity, focus etc ... because the mind gets more light and without this great weight and without great charges (even without many charges to ourselves) ... only there the person shows his true potential as a person and as master of mathematics .... the only advice I can give is what I do (even without being a master of mathematics or famous): I am sincere in what I do, true, I am myself, respectful and humble, and I love math .... these things I believe are the most important, and any deviation in this way is just another obstacle against showing our true self ... Hope this helps! Bless.

POSTED BY: Claudio Chaib

((RESULTS, Part 1 – Charts))

First I want to thank Mathematica team, as well as its developers, contributors and the featured contributors, which I greatly admire! Without Mathematica it would not be possible to generate the numbers to 10000 digits that I needed for the elaboration of this study of the randomness of the numbers.

Data (meaning):

C – Measure of deviation of the arithmetic means.

S – Measure of average deviation of the count of different digits.

T – Measure of deviation from the average result of the ´coin toss´, rounding up or down.

A – Reason between the amount of numbers that do repeat together and the total digits.

Each of the graphs below has: 10000 digits, step from 50 to 50 digits, 50 to 10000 (x-axis), 200 points (this is the maximum precision I have at the moment). Each chart has the same scale locked in the same interval so we can compare the graphs.

enter image description here

enter image description here

enter image description here

enter image description here

enter image description here

enter image description here

enter image description here

enter image description here

enter image description here

enter image description here

In each of the graphics and properties, the lower the value of the data, the better for the random application.

Soon I will post Part 2-Conclusion, with the numerical data.

I will use these numbers to come to a conclusion, however I can add any number to sampling any time.

POSTED BY: Claudio Chaib

((RESULT, Part 2 – Conclusion and Data Analysis))

Here is the result of calculating the area of the curves of each graphs. Each table is organized in rankings generated from the comparison of the values between the tests numbers (the lower the value, the better for random applications):

enter image description here

Now the complete table of numbers with their respective rankings:

enter image description here

Note that the number Champernowne (10)! is not the first ranked in any of the features, but its optimal performance and its high performance, for the time being, maintains it in the first place to choose random bases!

Incredibly there is a number with the A characteristic smaller than those of Pi, the number E^(1/Pi). But the yield of this in the other characteristics is poorer than the characteristics of C(10)! in general.

So FOR NOW the conclusion I reached is that the best choice is the C(10)! number for random use.

Hello community, If you have some number that want me to test and publish the chart and where it is in the rankings of the table, just be creative and post here for me to see! Maybe i'll build a database of Numbers. The number must have a Mathematica possible way to be generated or has to have 10000 digits! Thank you very much!

POSTED BY: Claudio Chaib

((RELEASE 2, Part 1 – Charts))

Hello community, I have compiled more notorious numbers in this Release 2 using the workbook 2.0. After computing more than 6GB and 5 more hours of data, here are 22 more numbers to add to the Database.

The following numbers had help from web pages for me to get the 10000 digits:

-Khinchin Constant, at the address: oeis.org/A002210/a002210.txt (number itself).

-MRB constant, at the address: oeis.org/A037077 (Mathematica Language for generate the number, posted by Marvin Ray Burns and supported by Wolfram website. Thanks.

All the numbers used have 10000 digits. All graphics have X-axis in the range from 50 to 10000 and the pass is 50 to 50 digits. It uses 200 points of precision. All the graphics are locked in the same range as the axes so we can compare.

Here are the charts:

enter image description here enter image description here

enter image description here

enter image description here

enter image description here

enter image description here

enter image description here

enter image description here

enter image description here

enter image description here

enter image description here

Be waiting for soon I will post here: Release 2, Part 2 – Conclusion and Data Analysis.

.... and so this way the database is increasing...

Thanks

POSTED BY: Claudio Chaib

((NEW UPDATE, Workbook 3.0 – High-Definition))

Configuration: using 5 workbooks, 4 calculating data and 1 creating the graph. Performance: 500 points, pass of 20 digits!!! (barely close to the ideal limit of pass between 10-20 digits!)

Workbook1: 110 points, 174MB, 18 minutes, range: 10000-7800 digits.

Workbook2: 141 points, 160MB, 15 minutes, range: 7780-5000 digits.

Workbook3: 200 points, 110MB, 9 minutes, range: 4980-1000 digits.

Workbook4: 49 points, 4.5MB, 4 minutes, range: 980-20 digits.

Workbook 5: Graph, 150KB, deal with 500 points.

Use: For high-definition graphics of high-performance candidate Numbers. To check the data of the best candidates, because the definition of 200 points already has a great performance to make a preview of the Result. Use to refine the calculation when necessary (time of more than 1 hour with the new 500 points workbook 3.0).

The numbers I check with this setting of 500 points will appear in the next RELEASE with a blue color in the Writing.

Number Pi chart image with 500 points (10000 digits, Pass of 20 digits):

enter image description here

... doing "science" in real time....

Until next RELEASE....
Thank you

POSTED BY: Claudio Chaib

It's a great honor for me that you Marvin have posted here in my humble study! :) I admire you a lot..

POSTED BY: Claudio Chaib

Ditto.

Claudio, I wonder if you or anyone else here can give me some advice: I feel that I've achieved just enough success that I would be devastated if I suddenly lost it. (I started checking my fameometer a little less often and that has helped me be more productive with new projects. I also have began to focus on the fact that there will always be a few people that respect me as a person of interest and a few who won't. These two things seem to help a little.)

Any more advice?

POSTED BY: Marvin Ray Burns

Please make sure you know the rules: https://wolfr.am/READ-1ST

Please do not create duplicate discussions on the same topic. This thread became too long. You do not have to comment every time - you can just edit and update the head post. Please consolidated meaningfully your comments into the head post removing redundant information.

Also please show usage of Wolfram Language. This forum permits only subjects related to Wolfram Technologies. Post elsewhere for other subjects (including general science & technology) or make clear the connection to Wolfram Technologies.

POSTED BY: Moderation Team

Excuse me for posting similar topics... will not happen again:)

POSTED BY: Claudio Chaib
Reply to this discussion
Community posts can be styled and formatted using the Markdown syntax.
Reply Preview
Attachments
Remove
or Discard

Group Abstract Group Abstract