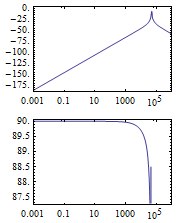
It seems like SetOptions does not work for at least some options for BodePlot.
I assumed that the following code should set the options:
SetOptions[BodePlot, {GridLines -> Automatic, ImageSize -> 500}];
Checking the Options seems to give the expected result:
In[114]:= Options[BodePlot, {GridLines, ImageSize}]
Out[114]= {GridLines -> Automatic, ImageSize -> 500}
However, when I run BodePlot without explicity setting the options, the plot doesn't contain Gridlines and it is not the expected ImageSize.
BodePlot[
TransferFunctionModel[{{{5. s}}, 0.004 (2.5*^9 + 1250. s + 1. s^2)},
s]]

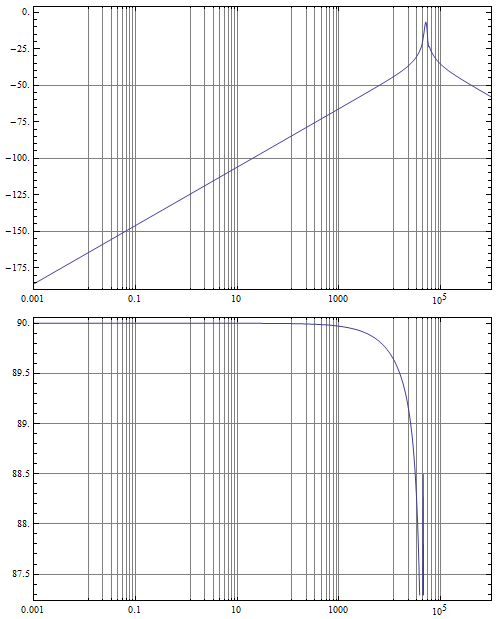
It works fine when I explicitly specify the options:
BodePlot[TransferFunctionModel[{{{5. s}},
0.004 (2.5*^9 + 1250. s + 1. s^2)}, s], GridLines -> Automatic,
ImageSize -> 500]

I couldn't find any notes regarding this behavior in the docs. What am I doing wrong?