Introduction
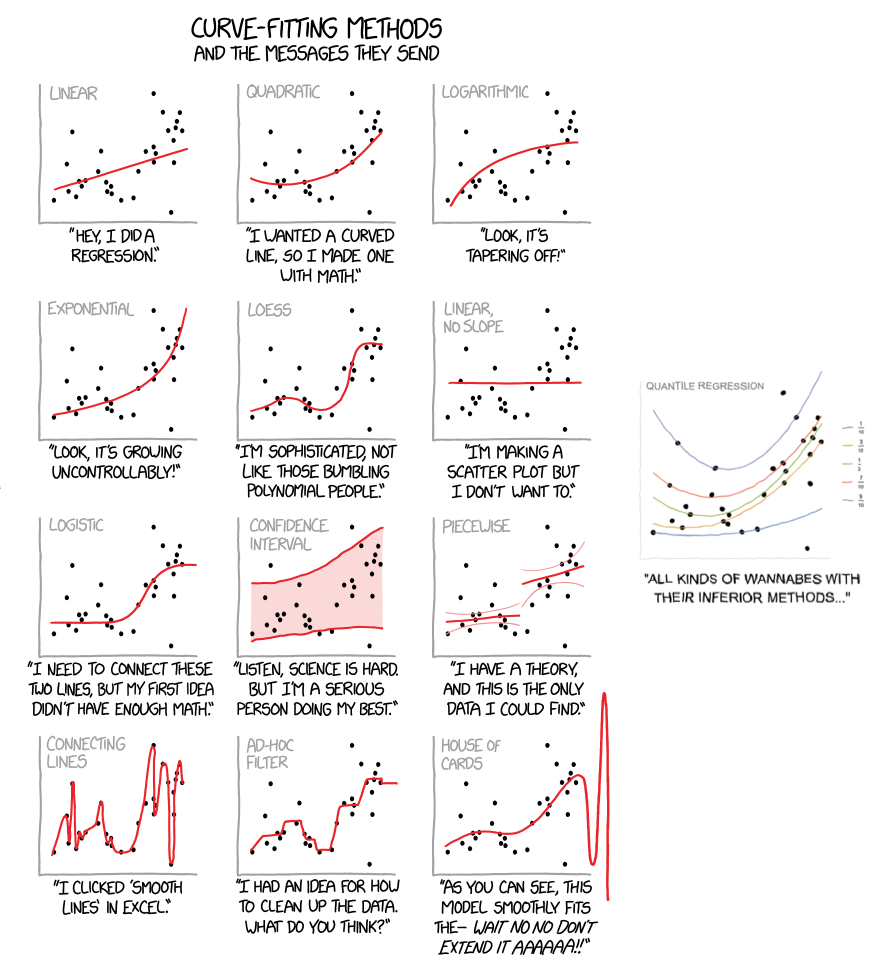
In this notebook/document we apply the monad QRMon, [4], over data of the XKCD post [1]. In order to get the data we used extraction procedure described in [2].
(And, yes, I am probably posting about Quantile Regression and QRMon too much...)
Extract data
I extracted the data from the image using code in the blog post "How to Count Cells, Annihilate Sailboats, and Warp the Mona Lisa", [2].
img = Import["https://imgs.xkcd.com/comics/curve_fitting.png"]
Original XKCD image.

Here is the extracted data:
extractedData = {{124.5, 131.3}, {133.9, 112.9}, {150.9, 112.1},
    {147.9, 103.9}, {146.5, 97.}, {139.5, 94.5}, {153.5, 94.},
    {43.5, 93.}, {144.5, 84.7}, {124.5, 78.}, {72., 74.},
    {116.5, 73.7}, {126.5, 71.5}, {125., 62.5}, {145.1, 62.1},
    {37.5, 61.}, {69.5, 53.5}, {109.5, 53.7}, {49.9, 45.1},
    {77.5, 43.}, {52.5909, 38.8636}, {82.5, 38.5}, {39.5, 33.7},
    {78.5, 33.3}, {81.9375, 31.125}, {47.5, 28.}, {104.409, 27.1364},
    {24.9, 24.9}, {92.5, 25.}, {142.5, 12.5}};

ListPlot[extractedData, AspectRatio -> 0.9, PlotRange -> All, PlotTheme -> "Detailed"]

Apply QRMon
Load packages. (For more details see [4,5].)
Import["https://raw.githubusercontent.com/antononcube/MathematicaForPrediction/master/MonadicProgramming/MonadicQuantileRegression.m"]
Import["https://raw.githubusercontent.com/antononcube/MathematicaForPrediction/master/MonadicProgramming/MonadicTracing.m"]
Apply the QRMon workflow within the TraceMonad:
trObj =
  TraceMonadUnit[QRMonUnit[extractedData]]?"lift data to the monad"?
   QRMonEchoDataSummary?"echo data summary"?
   QRMonEcho[Show[img, ImageSize -> 200], "XKCD:"]?"plot one of the curve-fitting XKCD plots"?
   QRMonQuantileRegressionFit[2, Range[1/10, 9/10, 2/10]]?"do Quantile Regression with\n\B-spline basis with 2 knots"?
   QRMonPlot["Echo" -> False, PlotStyle -> {Black, PointSize[0.025]},  AspectRatio -> 0.9, PlotLabel -> Style["QUANTILE REGRESSION", FontSize -> 24]
   ?"make the plot of the data and\n\regression curves without echoing it"?
   QRMonEchoFunctionValue["New plot:", xkcdConvert[#] &]?
   QRMonEcho["Tabulate steps and explanations:"]?"echo an explanation message"?
   TraceMonadEchoGrid;

Post processing
Here we just make the new XKCD plot made in QRMon pipeline above to look more like one of the curve-fitting plots in the original XKCD grid.
Get the plot from the monad and modify it:
newXKCDPlot = (trObj?TraceMonadTakeValue?QRMonTakeContext)["newXKCDPlot"];
newXKCDPlot = ReplaceAll[newXKCDPlot, HoldPattern[Frame -> _] -> (Frame -> None)];
newXKCDPlot = ReplaceAll[newXKCDPlot, HoldPattern[FrameTicks -> _] -> (Ticks -> None)];
newXKCDPlot = ReplaceAll[newXKCDPlot, HoldPattern[Axes -> _] -> (Axes -> False)];
newXKCDPlot = Show[{Graphics[{GrayLevel[0.8], Line[{{15, 5}, {160, 5}}], Line[{{15, 5}, {15, 140}}]},Epilog -> Text[Style["QUANTILE REGRESSION", Gray, 18], Scaled[{.35, .9}]]], newXKCDPlot}]
Convert the plot into XKCD style:
newXKCDPlot = xkcdConvert[newXKCDPlot];
Make an image with a comment in XKCD style:
xkcdComment =
  ImageCrop[
   Image[Graphics[
     Text[Style["\"ALL KINDS OF WANNABES WITH\nTHEIR INFERIOR METHODS...\"", Black, 20]]]]];
xkcdComment = xkcdConvert[xkcdComment];
Stack XKCD style images:
Grid[{{newXKCDPlot}, {Magnify[xkcdComment, 1.8]}}, Alignment -> Center]

XKCD style (by Simon Woods)
In order to make the notebook self-contained code-wise in this section is provided the code for converting any graphics object into an XKCD style version of it. (See [3].)
xkcdStyle = {FontFamily -> "Comic Sans MS", 16};

xkcdLabel[{str_, {x1_, y1_}, {xo_, yo_}}] :=
  Module[{x2, y2}, x2 = x1 + xo; y2 = y1 + yo;
   {Inset[
     Style[str, xkcdStyle], {x2, y2}, {1.2 Sign[x1 - x2],
      Sign[y1 - y2] Boole[x1 == x2]}], Thick,
    BezierCurve[{{0.9 x1 + 0.1 x2, 0.9 y1 + 0.1 y2}, {x1, y2}, {x2, y2}}]}];

xkcdRules = {
    EdgeForm[ef : Except[None]] :> EdgeForm[Flatten@{ef, Thick, Black}],
    Style[x_, st_] :> Style[x, xkcdStyle], Pane[s_String] :>
    Pane[Style[s, xkcdStyle]], {h_Hue, l_Line} :> {Thickness[0.02], White, l, Thick, h, l},
    Grid[{{g_Graphics, s_String}}] :> Grid[{{g, Style[s, xkcdStyle]}}],
    Rule[PlotLabel, lab_] :> Rule[PlotLabel, Style[lab, xkcdStyle]]};

xkcdShow[p_] := Show[p, AxesStyle -> Thick, LabelStyle -> xkcdStyle] /. xkcdRules

xkcdShow[Labeled[p_, rest__]] := Labeled[Show[p, AxesStyle -> Thick, LabelStyle -> xkcdStyle], rest] /. xkcdRules

xkcdDistort[p_] :=
  Module[{r, ix, iy},
   r = ImagePad[Rasterize@p, 10, Padding -> White];
   {ix, iy} =
    Table[RandomImage[{-1, 1}, ImageDimensions@r]~ImageConvolve~GaussianMatrix[10], {2}];

   ImagePad[
    ImageTransformation[r, # + 15 {ImageValue[ix, #], ImageValue[iy, #]} &, DataRange -> Full], -5]];

xkcdConvert[x_] := xkcdDistort[xkcdShow[x]]
References
[1] Randall Munroe, "Curve-Fitting", xkcd.org. https://xkcd.com/2048/ .
[2] Shadi Asnai, "How to Count Cells, Annihilate Sailboats, and Warp the Mona Lisa", (2012), blog.wolfram.com.
[3] Simon Woods, Mathematica Stackexchange answer to "xkcd-style Plots". https://mathematica.stackexchange.com/questions/11350/xkcd-style-plots.
[4] Anton Antonov, "A monad for Quantile Regression workflows", (2018), MathematicaForPrediction at WordPress.
[5] Anton Antonov, "Monad code generation and extension", (2017), MathematicaForPrediction at GitHub, https://github.com/antononcube/MathematicaForPrediction.