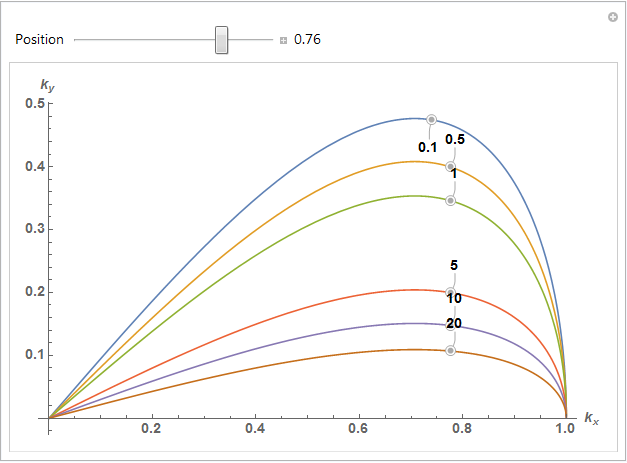
You may want to try experimenting with Callout[].
A2 = 1;
Manipulate[
 Plot[Evaluate@
   Table[Callout[Sqrt[x^2 - x^4]/Sqrt[1 + A2 \[Beta]], \[Beta], pos,
     CalloutMarker -> "CirclePoint"], {\[Beta], {.1, .5, 1, 5, 10,
      20}}], {x, 0, 1.2},
  AxesLabel -> {Subscript[k, x], Subscript[k, y]}, PlotRange -> All,
  LabelStyle -> Directive[14, Bold],
  ImageSize -> Large], {{pos, 0.8, "Position"}, 0, 1,
  Appearance -> "Labeled"}]
Update
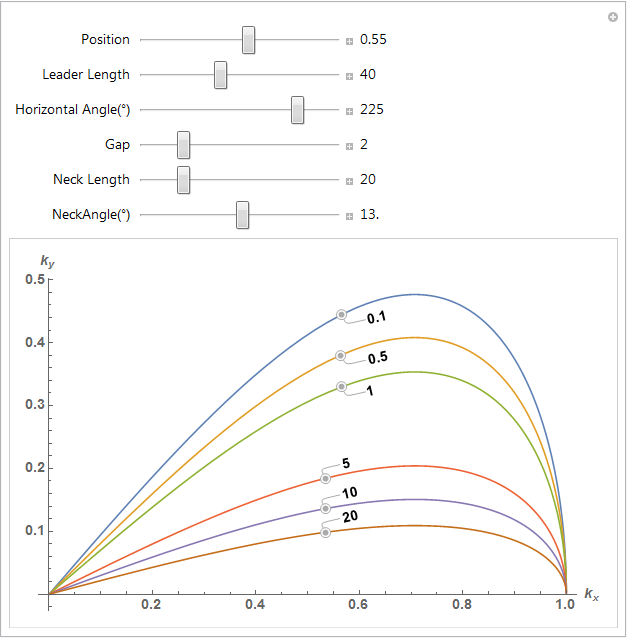
The LeaderSize option will give you more control over the callout placement. You can experiment with the manipulate below. For me, the largest effects were adjusting the Neck parameters.
A2 = 1;
m = Manipulate[
  Plot[Evaluate@
    Table[Callout[Sqrt[x^2 - x^4]/Sqrt[1 + A2 \[Beta]], \[Beta], pos,
      Background -> White,
      LeaderSize -> {{leadlen, horizangle Degree, gap}, {neck,
         neckangle Degree}},
      CalloutMarker -> "CirclePoint"], {\[Beta], {.1, .5, 1, 5, 10,
       20}}], {x, 0, 1.2},
   AxesLabel -> {Subscript[k, x], Subscript[k, y]}, PlotRange -> All,
   LabelStyle -> Directive[14, Bold],
   ImageSize -> Large], {{pos, 1/Sqrt[2], "Position"}, 0, 1,
   Appearance -> "Labeled"}, {{leadlen, 40, "Leader Length"}, 0, 100,
   Appearance -> "Labeled"}, {{horizangle, 225,
    "Horizontal Angle(\[Degree])"}, -360, 360,
   Appearance -> "Labeled"}, {{gap, 2, "Gap"}, 0, 10,
   Appearance -> "Labeled"}, {{neck, 20, "Neck Length"}, 0, 100,
   Appearance -> "Labeled"}, {{neckangle, 20,
    "NeckAngle(\[Degree])"}, -360, 360, Appearance -> "Labeled"}]