The code contains errors related to the formatting of the input data. Functions depend on r as on the parameter. Assuming that all functions depend only on one variable
$\xi $, we find the system of the ODE, in which we make one change in order to eliminate the solution in the complex plane:
$B=1+Qd 2 \pi (k1ro1)^2 f3[\xi]$
As a result, we find
w1 = 2.126*10^15;
w2 = 4.270*10^15;
wp = 1.78*10^13;
m = 9.1*10^-28;
c = 3*10^10;
e = 4.8*10^-10;
ro1 = 40*10^-4;
ro2 = 40*10^-4;
wr = (wp*ro1)/c;
l = 0.234;
k1 = 70861.75 + 0.0755*I;
eo1 = 1 - wp^2/w1^2;
eo2 = 1 - wp^2/w2^2;

Qd = 6.12*10^(-11) - 8.9*I*10^(-10);
eq = {f1''[\[Xi]] - 1/
     f1[\[Xi]]^3 + (wr^2*f1[\[Xi]])/
      2*(0.1/f1[\[Xi]]^4 + 0.2/(ro2^2*f2[\[Xi]]^4))*
      Exp[(-0.1/f1[\[Xi]]^2 - 0.2/f2[\[Xi]]^2)] == 0,
   f2''[\[Xi]] - 1/
     f2[\[Xi]]^3 + (wr^2*eo1*f2[\[Xi]]*0.5)/(
      2*eo2)*(0.1/f1[\[Xi]]^4 + 0.2/(ro2^2*f2[\[Xi]]^4))*
      Exp[(-0.1/f1[\[Xi]]^2 - 0.2/f2[\[Xi]]^2)] == 0,
   f3'[\[Xi]] + (Exp[-r^2/f1[\[Xi]]^2]*Exp[-1/(2*f2[\[Xi]]^2)])/(
     f1[\[Xi]]^2*f2[\[Xi]]) == 0};
bc = {f1[0] == 1, f1'[0] == 0, f2[0] == 10, f2'[0] == 0, f3[0] == 0};
F3 = ParametricNDSolveValue[{eq, bc}, f3, {\[Xi], 0, 15}, {r}];
F1 = ParametricNDSolveValue[{eq, bc}, f1, {\[Xi], 0, 15}, {r}];
F2 = ParametricNDSolveValue[{eq, bc}, f2, {\[Xi], 0, 15}, {r}];

{Plot[Evaluate[Table[F1[r][\[Xi]], {r, 0, 3, 1}]], {\[Xi], 0, 2},
  PlotRange -> All, AxesLabel -> {"\[Xi]", "f1"}],
 Plot[Evaluate[Table[F2[r][\[Xi]], {r, 0, 3, 1}]], {\[Xi], 0, 2},
  PlotRange -> All, AxesLabel -> {"\[Xi]", "f2", ""}],
 Plot[Evaluate[
   Table[Abs[1 + Qd*k1^2*2*Pi*(ro1)^2*F3[r][\[Xi]]], {r,
     0, .5, .1}]], {\[Xi], 0, 2}, PlotRange -> All,
  AxesLabel -> {"\[Xi]", ""}, PlotLabel -> "normalized intensity",
  PlotLegends -> Automatic]}
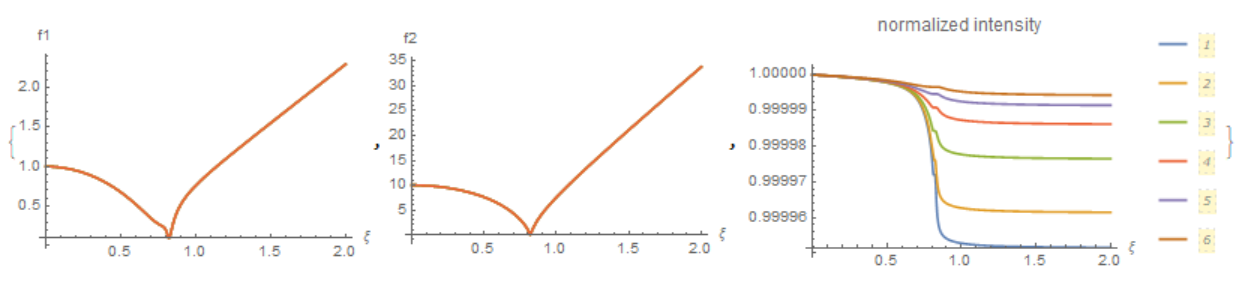
From the above figure we see that only f3 and, accordingly, B depends on the parameter r.
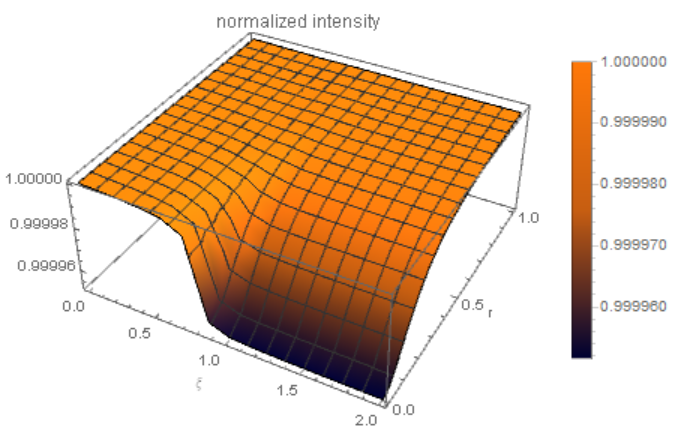
Plot3D[Evaluate[Abs[1 + Qd*k1^2*2*Pi*(ro1)^2*F3[r][\[Xi]]]], {\[Xi],
  0, 2}, {r, 0, 1}, PlotRange -> All, AxesLabel -> {"\[Xi]", "r", ""},
  PlotLabel -> "normalized intensity", PlotLegends -> Automatic,
 ColorFunction -> "RustTones"]