Message Boards Message Boards

0
|
5087 Views
|
4 Replies
|
4 Total Likes
View groups...
Share
Share this post:

Find centerline and width of a 2D or 3D data point cloud?

I want to calculate the errors in a 3D printed part relative to a reference. I have a laser scanner which scans across a 3D printed part and outputs a large 3D data point cloud, which is representative of the deposited material in space.

3D printed part

Laser scanner 3D data point cloud plotted in XYZ plane

I then project these data points onto the 2D XY plane (flatten), and now I would like to extract the width and centerline of the 2D data point cloud to get an idea of the material width and path along the trajectory (to be able to compare to the reference).

Data points projected onto the XY plane. The data is plotted as red circles in matlab.

I accomplished this in Matlab through a lot of painful, manual steps in Matlab, but am looking to see techniques are available in mathematica.

Again, I would like to extract the material width along the trajectory, and the ceterline of these data points. I can convert the data points into an image as well.

Data points converted into an image in matlab

Any tips on what functions I can use in Mathematica and how this can be accomplished?

POSTED BY: Ashley Armstrong
4 Replies

Hi Henrik,

Thanks for the suggestion. I will look more into this solution.

Best, Ashley

POSTED BY: Ashley Armstrong

Hi Ashley,

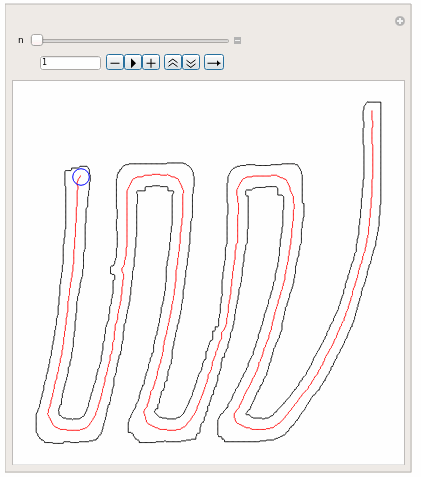
to be honest I do not have at the moment a really good idea of how to determine the width. What I am doing here is simply to determine the border of this structure an calculate the closest distance from the inner trajectory to this border using Nearest. The code (continuing from the above) should be self explaining:

trajectoryPoints = PixelValuePositions[img3, 1];
order = Last[FindShortestTour[trajectoryPoints]];
trajectoryLinePoints = trajectoryPoints[[Rest@order]];
pp = First[1 /. ComponentMeasurements[img2, "PerimeterPositions"]];
Manipulate[
 Graphics[{Line[pp], Red, Line[trajectoryLinePoints], Blue, 
   Circle[trajectoryLinePoints[[n]], 
    EuclideanDistance[trajectoryLinePoints[[n]], 
     First@Nearest[pp, trajectoryLinePoints[[n]]]]]}], {n, 1, 
  Length[trajectoryLinePoints], 1}]

This gives (as a demo for this idea):

enter image description here

Hopefully this helps a bit, regards -- Henrik

POSTED BY: Henrik Schachner

Hi Henrik,

Thank you so much! This is definitely useful and I will give it a try.

Any tips on finding the width along the trajectory?

Thank you!

POSTED BY: Ashley Armstrong

Hi Ashley,

I start using your raster image. Here is a simple way to extract the trajectory:

img0 = Import["http://community.wolfram.com//c/portal/getImageAttachment?filename=image.png&userId=1533207"];
img1 = ImagePad[ImageCrop[Binarize@img0], {{0, 0}, {0, -20}}];
img2 = Dilation[Opening[img1, 2], 2];
img3 = Thinning[img2];
HighlightImage[img1, img3]

This gives the trajectory as an image (here in red as an overlay):

enter image description here

You probably rather want the trajectory as points along a line, then try:

trajectoryPoints = PixelValuePositions[img3, 1];
order = Last[FindShortestTour[trajectoryPoints]];
Graphics[Line[trajectoryPoints[[Rest@order]]]]

But I guess it is better to start out using data points instead of a raster image.

Regards -- Henrik

POSTED BY: Henrik Schachner
Reply to this discussion
Community posts can be styled and formatted using the Markdown syntax.
Reply Preview
Attachments
Remove
or Discard

Group Abstract Group Abstract