Message Boards Message Boards

Find the curvature of an object from an image

curvatureMeasure.m is a Mathematica script for calculating curvature along the boundary of an image object. It might be useful to people working in the computer vision community. This simple script can be easily extended to even track the curvature of an object as it deforms (will add soon) across several images.

Here is our input image:

enter image description here

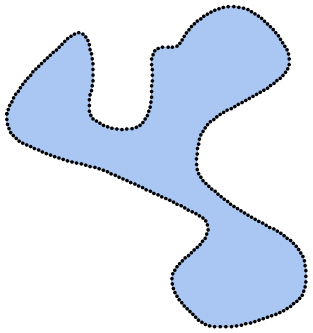
boundary is discretized into equidistant points
enter image description here

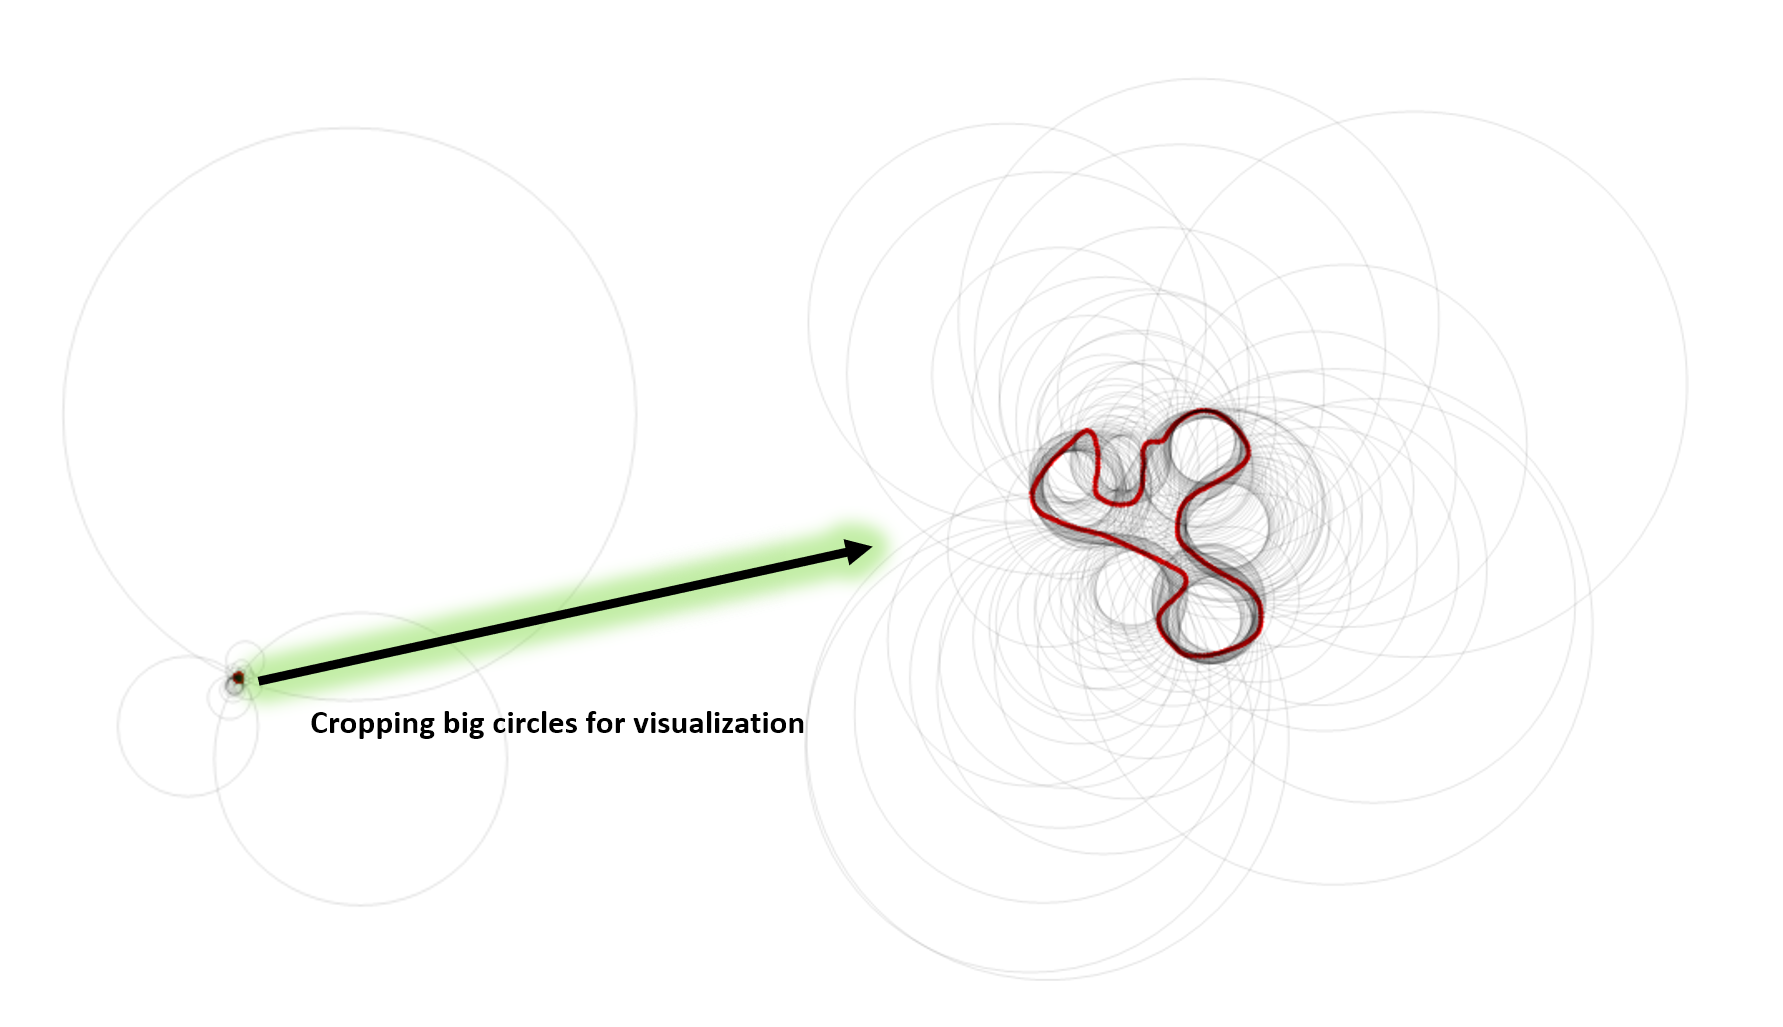
circle fits to a given point point Pi, Pi + N-left, Pi + N-right, where N is the neighbour to the point Pi.
enter image description here

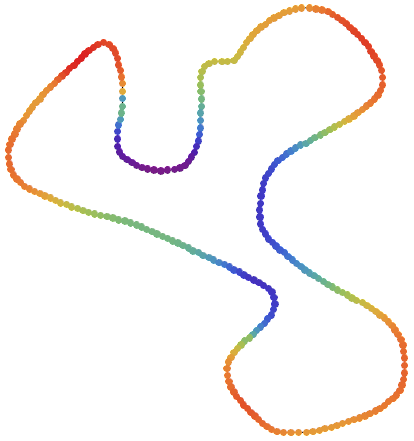
curvatures (found as 1/radius) is the colormap:
enter image description here

code

(* ::Package:: *)

BeginPackage["curvatureMeasure`"];


curvatureMeasure::usage = "measures the curvature along the image object";


Begin["`Private`"];


shiftPairs[perimeter_,shift_]:=Module[{newls},
newls=perimeter[[-shift;;]]~Join~perimeter~Join~perimeter[[;;shift]];
Table[{newls[[i-shift]],newls[[i]],newls[[i+shift]]},{i,1+shift,Length[newls]-shift}]
];

(* we can either use the suppressed code below to fit circles or the Built-In Circumsphere to find the fits 
(* from Mathematica StackExchange: courtesy ubpdqn *)
circfit[pts_]:=Module[{reg,lm,bf,exp,center,rad},
reg={2 #1,2 #2,#2^2+#1^2}&@@@pts;
lm=LinearModelFit[reg,{1,x,y},{x,y}];
bf=lm["BestFitParameters"];
exp=(x-#2)^2+(y-#3)^2-#1-#2^2-#3^2&@@bf;
{center,rad}={{#2,#3},Sqrt[#2^2+#3^2+#1]}&@@bf;
circlefit[{"expression"->exp,"center"->center,"radius"->rad}]
];
circlefit[list_][field_]:=field/.list;
circlefit[list_]["Properties"]:=list/.Rule[field_,_]:>field;
circlefit/:ReplaceAll[fields_,circlefit[list_]]:=fields/.list;
Format[circlefit[list_],StandardForm]:=HoldForm[circlefit]["<"<>ToString@Length@list<>">"]
*)

curvatureMeasure[img_Image,div_Integer,shift_Integer]:=Module[{\[ScriptCapitalR],polygon,t,interp,sub,sampledPts,
pairedPts,circles,\[Kappa],midpts,regMem,col,g,fn},
\[ScriptCapitalR] = ImageMesh[img, Method -> "Exact"];
polygon = Append[#,#[[1]]]&@MeshCoordinates[\[ScriptCapitalR]][[ MeshCells[\[ScriptCapitalR],2][[1,1]] ]];
t = Prepend[Accumulate[Norm/@Differences[polygon]],0.];
interp = Interpolation[Transpose[{t,polygon}],InterpolationOrder -> 1,
PeriodicInterpolation->True];
sub = Subdivide[interp[[1,1,1]],interp[[1,1,2]],div];
sampledPts = interp[sub];
Print[Show[\[ScriptCapitalR],Graphics@Point@sampledPts,ImageSize-> 250]];
pairedPts = shiftPairs[sampledPts, shift];

circles = (Circumsphere/@pairedPts)/. Sphere -> Circle;
(*circles = (fn=circfit[#]; Circle[fn["center"],fn["radius"]])&/@pairedPts;*)

Print[Graphics[{{Red,Point@sampledPts},{XYZColor[0,0,0,0.1],circles}}]];
\[Kappa] = 1/Cases[circles,x_Circle:> Last@x];
midpts = Midpoint/@pairedPts[[All,{1,-1}]];
regMem = RegionMember[\[ScriptCapitalR],midpts]/.{True-> 1,False-> -1};
\[Kappa] *= regMem;
col = ColorData["Rainbow"]/@Rescale[\[Kappa], MinMax[\[Kappa]],{0,1}];
g = Graphics[{PointSize[0.018],MapThread[Point[#1,VertexColors->#2]&,{sampledPts,col}]}];
Print[Show[HighlightMesh[\[ScriptCapitalR],{Style[1, Black],Style[2,White]}],g,ImageSize->Medium]];
\[Kappa]
]


End[];
EndPackage[];
Attachments:
POSTED BY: Ali Hashmi
5 Replies

Some comments:

  • A spectral method to compute derivatives is built-in
  • The Gaussian is built-in as the PDF of the NormalDistribution
  • GaussianMatrix gives a matrix that corresponds to a Gaussian kernel of radius $r$
  • Since the package uses Interpolation, after smoothing, one could use this to compute derivatives and curvature directly
  • The work of Bart ter Haar Romeny’s group is relevant to this topic
POSTED BY: Paul Abbott

Interesting! An alternative way to do this is using convolution with Gaussian functions to take the derivatives and second derivatives around the curve and use the formula for signed curvature:

k = (xu*yuu - xuu*yu)/((xu^2 + yu^2)^(3/2))

Where xu is the derivative of the x coordinates, xuu is the second derivative of the x coordinates, and yu and yuu are the same for the y coordinates. Computing the derivatives like this is the basis of the Curvature Scale Space image introduced in the mid-1980s, which is a method for characterizing the curvature of a shape at different scales (where the scale corresponds to the width, sigma, of the Gaussian).

We can define the Gaussian and its derivatives as:

gaussian[x_, \[Sigma]_] := 1/(\[Sigma]*Sqrt[2*\[Pi]]) * Exp[-(x^2)/(2*\[Sigma]^2)]
dgaussian[x_, \[Sigma]_] := D[gaussian[y, \[Sigma]], y] /. y -> x
ddgaussian[x_, \[Sigma]_] := D[dgaussian[y, \[Sigma]], y] /. y -> x

These can be used to generate the convolution kernel for a sequence of points pts and a given sigma value:

makeKernel[f_, pts_, \[Sigma]_] := Table[f[x, \[Sigma]], {x, -Length[pts]/2, Length[pts]/2}]

The curvature then can be defined as:

k[pts_, \[Sigma]_] := Module[
   {xu, xuu, yu, yuu},
   xu = ListConvolve[makeKernel[dgaussian, pts, \[Sigma]], pts[[;; , 1]], 1];
   xuu = ListConvolve[makeKernel[ddgaussian, pts, \[Sigma]], pts[[;; , 1]], 1];
   yu = ListConvolve[makeKernel[dgaussian, pts, \[Sigma]], pts[[;; , 2]], 1];
   yuu = ListConvolve[makeKernel[ddgaussian, pts, \[Sigma]], pts[[;; , 2]], 1];
   (xu*yuu - xuu*yu)/(((xu^2) + (yu^2))^(3/2))];

Using your image and the points derived from the boundary of the shape with a sigma value of 20, we get this:

\[Kappa] = k[pts, 20];

col = ColorData["Rainbow"] /@ Rescale[\[Kappa], MinMax[\[Kappa]], {0, 1}];

g = Graphics[{PointSize[0.018], MapThread[Point[#1, VertexColors -> #2] &, {pts, col}]}]

The result doesn't look exactly the same as yours, but is roughly similar.

Image with curvature coloring

An alternative method to this that I've used in the past is to use a spectral method to compute the derivatives. Unfortunately I only have that code in Matlab and haven't ported it to Mathematica.

POSTED BY: Matthew Sottile

Thanks. This is an awesome method. Do you mind if I add your code to my GitHub repository with your name?

POSTED BY: Ali Hashmi

Sure. It’s worth noting that the curvature given by that method is the curvature of the shape smoothed by the Gaussian of a given width. It’s sometimes easier to interpret in terms of the smoothed curve instead of the original points.

POSTED BY: Matthew Sottile

enter image description here - Congratulations! This post is now a Staff Pick as distinguished by a badge on your profile! Thank you, keep it coming, and consider contributing your work to the The Notebook Archive!

POSTED BY: EDITORIAL BOARD
Reply to this discussion
Community posts can be styled and formatted using the Markdown syntax.
Reply Preview
Attachments
Remove
or Discard

Group Abstract Group Abstract