I need individual series to be shown on the Z axis in a 3D bar chart. However, when I I use BarChart3D it places the series side-by-side. The documentation has a weather chart example but it is hard to understand how they got what they did without knowing something about their actual data. This is what I have that is not right:
BarChart3D[{{1, 2, 3, 4}, {4, 3, 2, 1}, {3, 2, 1, 4}}]
And it produces a chart that looks like: 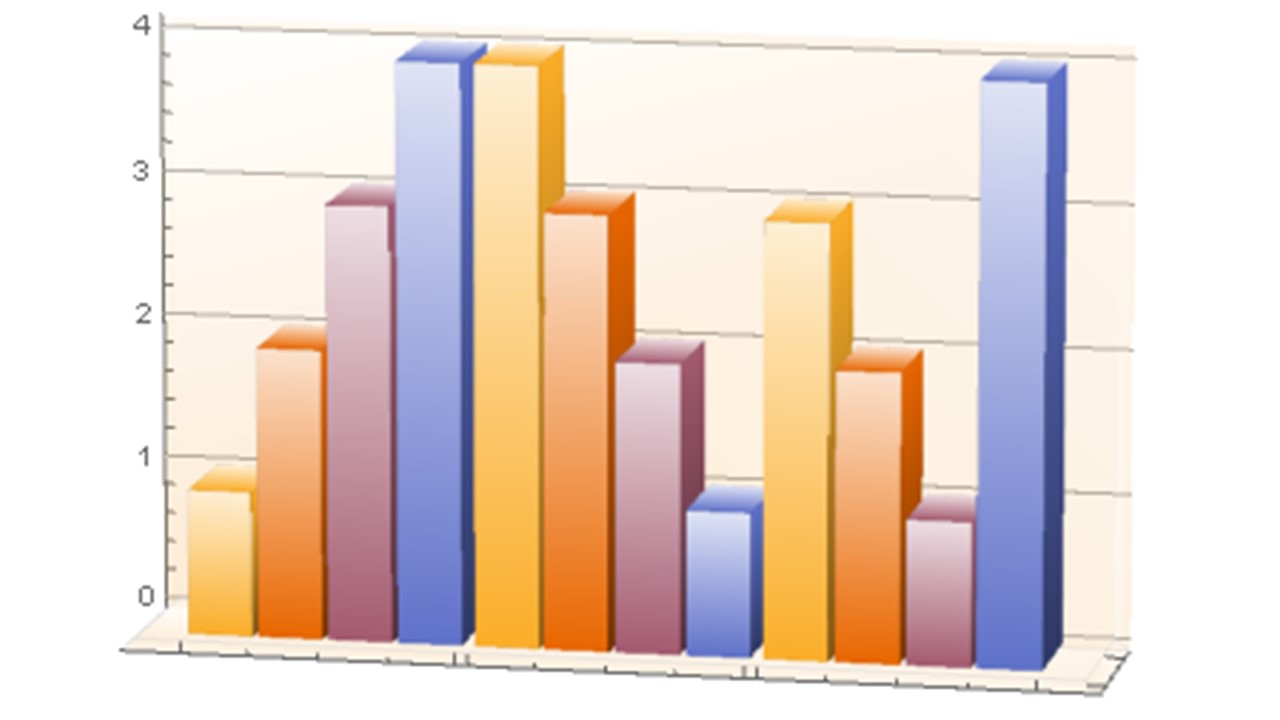 However, I need a chart that looks like:
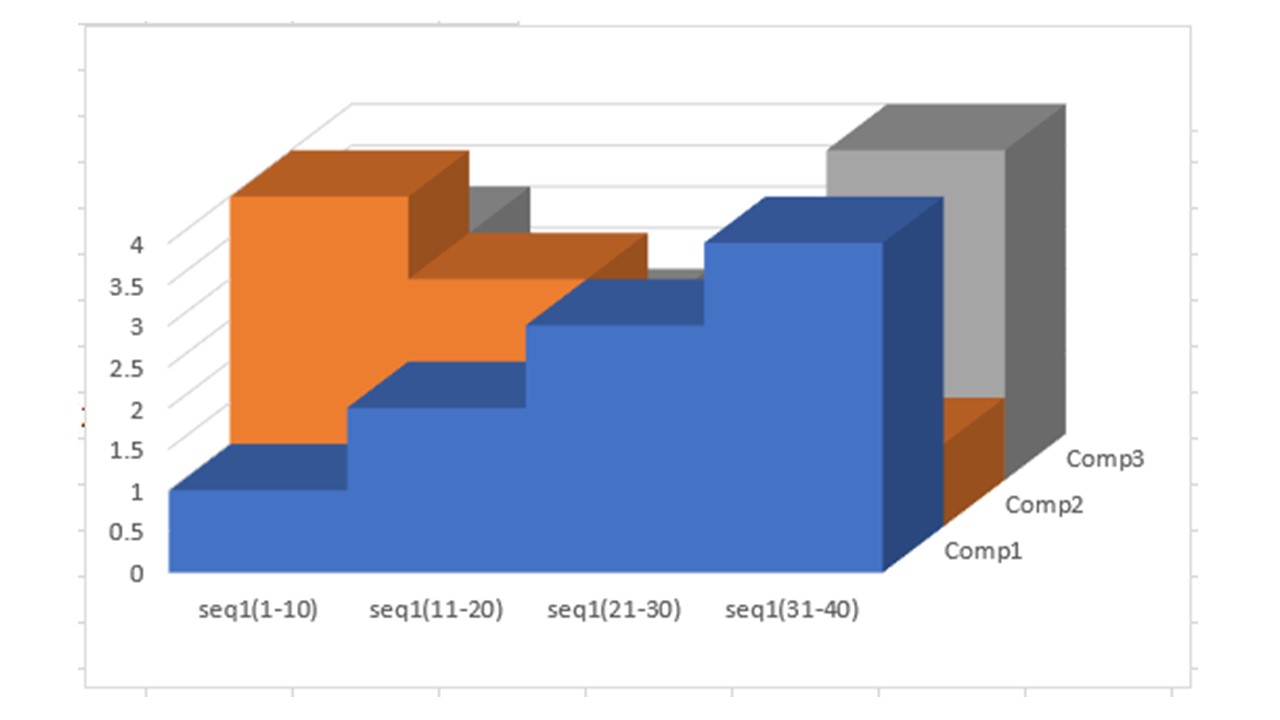
I know this is probably just a styling option but I cannot find it in the documentation.


