Message Boards Message Boards

0
|
3268 Views
|
2 Replies
|
0 Total Likes
View groups...
Share
Share this post:
GROUPS:

How do I get the Piecewise function into a form I can plot?

I have the piecewise function
l3=Piecewise[{{1,x<=0},{4,0<x<=1},{5,1<x<=3},{2,3<x<=5}},1]
l1=sol1[x]
l2=sol3[x]
l4[x_]:=PiecewiseExpand[l1/l3]
sol03p=Plot[{l4[x]},{x,-.1,1.3},Filling->Axis,Exclusions->None]
I need the resulting Piecewise function converted to a function that I can plot. 
POSTED BY: Jose Calderon
2 Replies
May be I am missing something. But Plot can plot Piecewise as is. 
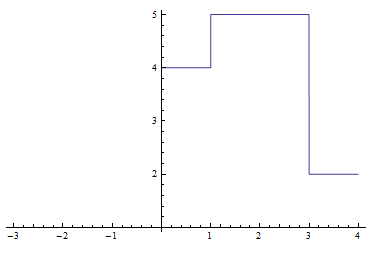
L3 = Piecewise[{{1, x <= 0}, {4, 0 < x <= 1}, {5, 1 < x <= 3}, {2, 3 < x <= 5}}, 1];
Plot[L3, {x, -3, 4}, Exclusions -> None]


btw, it is not really a good idea to use the single letter l as a variable, since on most fonts and on the screen it looks like 1 and makes it hard to read the code. In this case, using L1 or L2 is ok, even though we broke the golden rule of using UpperCase for first letter for a variable, but since it is a 2 letter variable, and has a digit in the sescond place, there is no chance that WL will use such a symbol in the future. So it is safe to use it and it makes the code easier to read.
POSTED BY: Nasser M. Abbasi
What's sol1 ?
POSTED BY: Frank Kampas
Reply to this discussion
Community posts can be styled and formatted using the Markdown syntax.
Reply Preview
Attachments
Remove
or Discard

Group Abstract Group Abstract