Group Abstract Group Abstract

Message Boards Message Boards

0
|
11.2K Views
|
2 Replies
|
1 Total Like
View groups...
Share
Share this post:

[?] Plot two functions in the same contour plot?

Hi guys i'm new to Mathematica and have what i think may be a simple problem. Say i have two functions of two variables:

f[x_,y_] = x²Sin[y] + y³Cos[x]²


g[x_,y_] = Sin[x]Sin[y]² + x*y*Sin[x]

There is a way to declare this functions and then plot the contours of this two functions in the same graph for exemple f in full lines an g in dash ones.

POSTED BY: Leonardo Souza
2 Replies

Thank you!

POSTED BY: Leonardo Souza
Posted 6 years ago
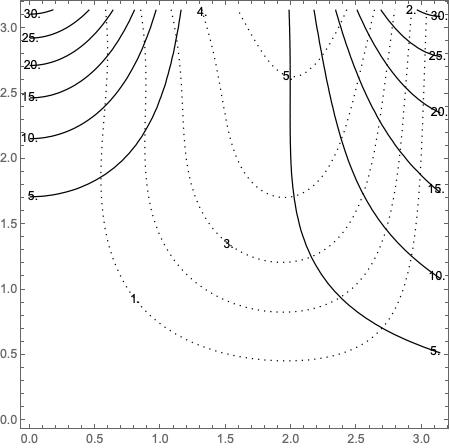
f[x_, y_] := x^2 Sin[y] + y^3 Cos[x]^2 
g[x_, y_] := Sin[x] Sin[y]^2 + x y Sin[x]

Show[ContourPlot[f[x, y], {x, 0, Pi}, {y, 0, Pi}, 
  ContourShading -> None, ContourLabels -> All], 
 ContourPlot[g[x, y], {x, 0, Pi}, {y, 0, Pi}, ContourShading -> None, 
  ContourLabels -> All, ContourStyle -> Dotted]]

enter image description here

POSTED BY: Rohit Namjoshi
Reply to this discussion
Community posts can be styled and formatted using the Markdown syntax.
Reply Preview
Attachments
Remove
or Discard