Markus,
The automatic frameticks on the right and top do not match the bottom and left. You can leave them off with
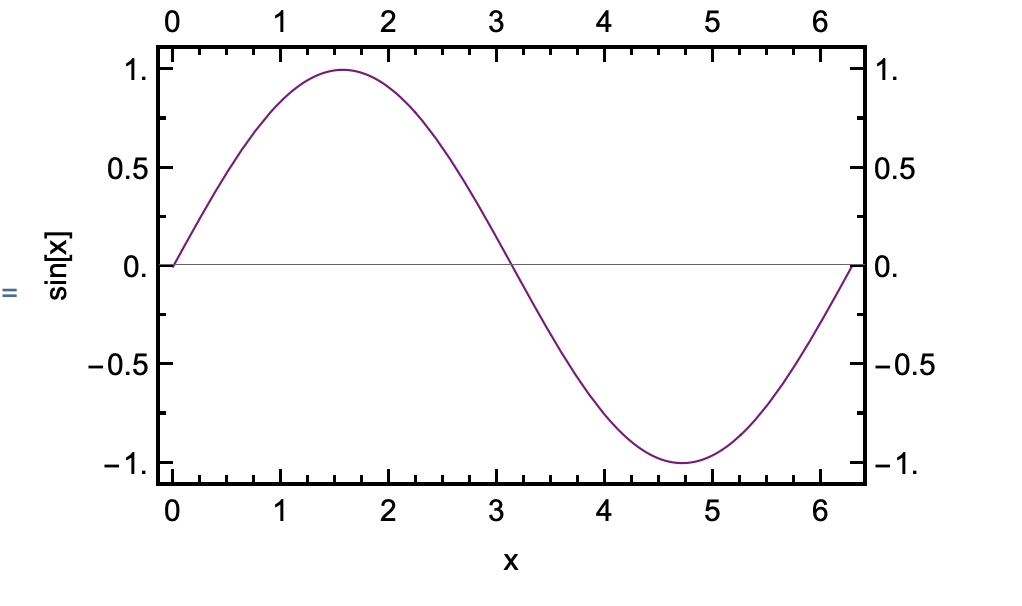
Plot[Sin[x], {x, 0, 2*\[Pi]}, Frame -> True, ImageSize -> 300,
 FrameStyle -> Directive[Black, Thickness[0.003]],
 FrameTicks -> {{Automatic, None}, {Automatic, None}},
 LabelStyle -> Directive[Black, 10], FrameLabel -> {"x", "sin[x]"},
 PlotStyle -> Directive[Thickness[0.003], Purple]]
or you can specify them in FrameTicks. I suggest that you make a function to make the FrameTicks such as
ticker[min_, max_, major_, minor_] :=
 Map[{#, #, {0.02, 0}} &, Range[min, max, major]]~Join~
  Map[{#, ""} &, Subdivide[min, max, minor*(max - min)]]
This will put major ticks spaced between "min" and "max" divided up by "major" (major is in actual units) and then add minor, unlabeled ticks with each integer divided by "minor" (minor is an integer such as 4 meaning 4 ticks per integer value).
For example:
Plot[Sin[x], {x, 0, 2*\[Pi]}, Frame -> True, ImageSize -> 300,
 FrameStyle -> Directive[Black, Thickness[0.003]],
 FrameTicks -> {{ticker[-1, 1, 0.5, 4],
    ticker[-1, 1, 0.5, 4]}, {ticker[0, 6, 1, 4], ticker[0, 6, 1, 4]}},
  FrameTicksStyle -> Directive[Black, 10],
 LabelStyle -> Directive[Black, 10], FrameLabel -> {"x", "sin[x]"},
 PlotStyle -> Directive[Thickness[0.003], Purple]]
Gives
Naturally you can edit the function ticker to alter the style of the minor and major ticks such as length
Regards,
Neil


