I plotted this graph
 with this command:
Labeled[Show[
Plot[in, {r, 0, a},
Ticks -> {{{a, "a"}, {3 a, "3a"}, {5 a, "5a"}, {7 a, "7a"}, {9 a,
"9a"}, {12 a, "12a"}}, {0, 2.2*^-11}}, PlotRange -> All],
Plot[out, {r, a, 12 a}], PlotRange -> All, AxesStyle -> Black,
AxesLabel -> {r, "Intensity"},
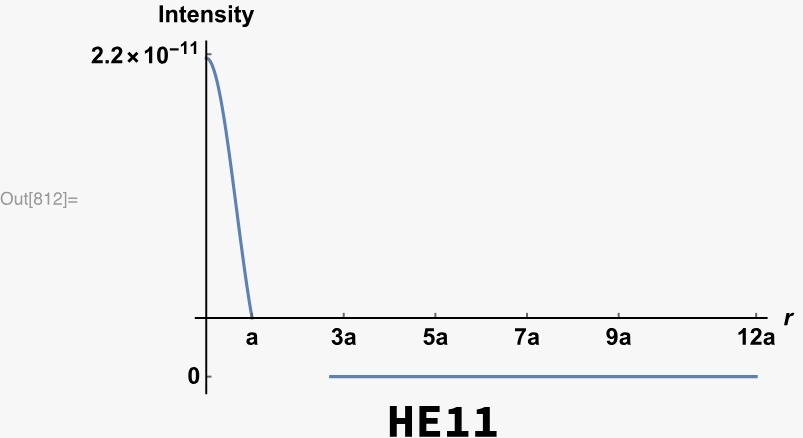
LabelStyle -> Directive[Bold, Medium]], Style["HE11", Bold, Large]]
in is a function to be plotted between 0 to a,
and
out is a function to be plotted between a to 12a.
As you can see, the r (horizontal axis) doesn't lie with the y=0 line. How can I fix this?
Should I instruct the PlotRange option in the Show function, rather than inside the second Plot? (I tried, but no graphics was produced).


