I need to plot points of a graph, 2 being the x intercepts and 2 being the max and min values. My directions tell me to plot them on the same plot list function and the max and min need to be colored red and the intercepts need to be green. this is a stupidly simple question but everything about this program confuses me. I also need to then take those points with the same color and the put them onto the function graph which i feel like i understand how to do. If you can help me out it would be greatly appreciated.
David,
Since you provided no code or data sample it is not clear what you are trying to plot. Maybe this?
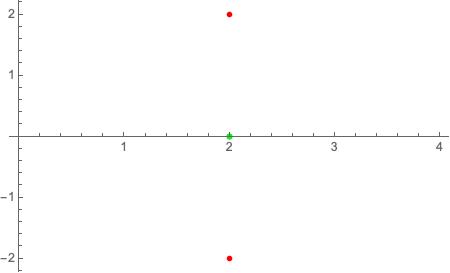
points = {{2, 0}, {2, 2}, {2, -2}} ListPlot[{{Style[points[[1]], Green]}, Style[points[[2 ;; 3]], Red]}]