Message Boards Message Boards

Make a histogram with aggregated monthly average seasonal weather data?

Posted 5 years ago

Hi I have some twenty years of weather data with daily average temperature. I would like to make a histogram with aggregated monthly average for the whole period. I tried to do something like this https://www.wolfram.com/language/11/time-series-processing/trends-and-seasonalities.html?product=language But it didn’t work since my weights in WeightedData can be both positive and negative. My data looks like this: i8u

Any help would be much appreciated

POSTED BY: nils hofvander
4 Replies
Posted 5 years ago

Hi Nils,

I think I understand what you are trying to do, but I still don't understand why weighting by temperature is needed. Does something like this satisfy your requirements?

Since your profile says you are in Sweden, get the daily mean temperature in Stockholm for 2008 to 2018

byDay = WeatherData["Stockholm", "MeanTemperature", {{2008, 1, 1}, {2018, 12, 31}, "Day"}]

Average over months (could have specified "Month" in WeatherData, but you have data by day)

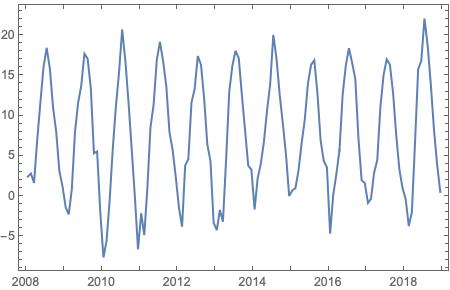
byMonth = TimeSeriesAggregate[byDay, "Month", Mean]

Plot looks reasonable

DateListPlot[byMonth]

enter image description here

Group the data by month name

groupByMonth = GroupBy[byMonth["DatePath"], DateValue[First[#], "MonthNameShort"] &]

Compute average by month

meanByMonth = Mean[Map[Last, #]] & /@ groupByMonth
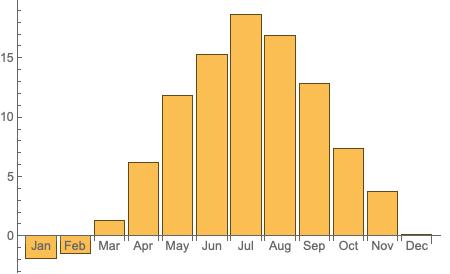
Plot BarChart

BarChart[meanByMonth, ChartLabels -> Automatic]

enter image description here

You could also compute min, max and mean

minMaxMean = {Min[Map[Last, #]], Max[Map[Last, #]], Mean[Map[Last, #]]} & /@ groupByMonth

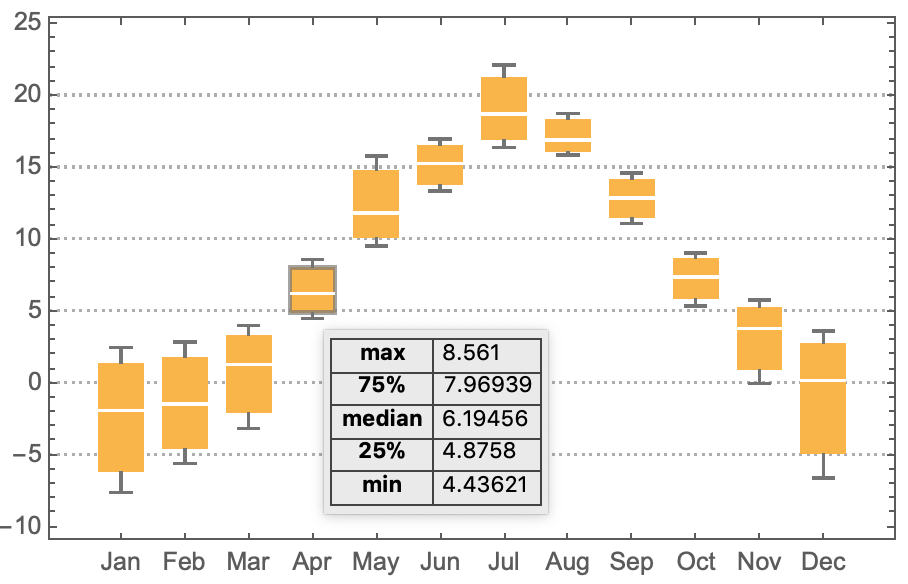
and visualize as a BoxWhiskerChart

BoxWhiskerChart[minMaxMean, ChartLabels -> Automatic, PlotTheme -> "Detailed"]

enter image description here

POSTED BY: Rohit Namjoshi

Great! thats a really good answer, thanks alot

POSTED BY: nils hofvander
Posted 5 years ago

Can you explain why you need to weight the data to compute monthly averages? Why can't you use TimeSeriesAggregate?

POSTED BY: Rohit Namjoshi

My goal is to make a histogram of the average seasonal variation so i need the January in that diagram to be the average for all Januaries over the period. The same for Feb, Mar and so on. First i used TimeSerieAggregate to make a monthly series. Then i tried (as you can see in the last part of my link) to make a DateHistogram. Then i realized that i can’t use the same method as the link because my weights (being temperature) could be both negative and positive, so I need another way of doing a histogram with the total average temperature for each month during the whole period.

POSTED BY: nils hofvander
Reply to this discussion
Community posts can be styled and formatted using the Markdown syntax.
Reply Preview
Attachments
Remove
or Discard

Group Abstract Group Abstract