Hi Nils,
I think I understand what you are trying to do, but I still don't understand why weighting by temperature is needed. Does something like this satisfy your requirements?
Since your profile says you are in Sweden, get the daily mean temperature in Stockholm for 2008 to 2018
byDay = WeatherData["Stockholm", "MeanTemperature", {{2008, 1, 1}, {2018, 12, 31}, "Day"}]
Average over months (could have specified "Month" in WeatherData, but you have data by day)
byMonth = TimeSeriesAggregate[byDay, "Month", Mean]
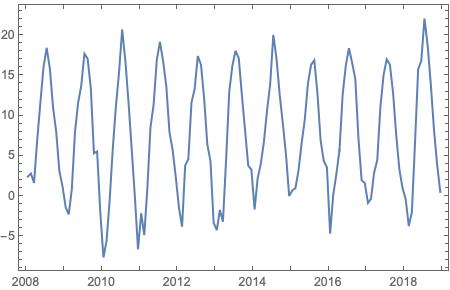
Plot looks reasonable
DateListPlot[byMonth]

Group the data by month name
groupByMonth = GroupBy[byMonth["DatePath"], DateValue[First[#], "MonthNameShort"] &]
Compute average by month
meanByMonth = Mean[Map[Last, #]] & /@ groupByMonth
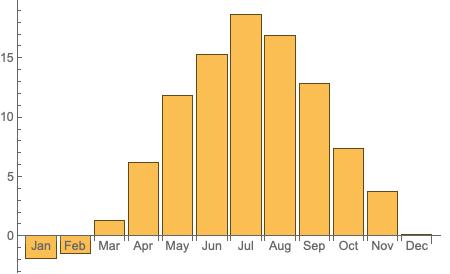
Plot BarChart
BarChart[meanByMonth, ChartLabels -> Automatic]

You could also compute min, max and mean
minMaxMean = {Min[Map[Last, #]], Max[Map[Last, #]], Mean[Map[Last, #]]} & /@ groupByMonth
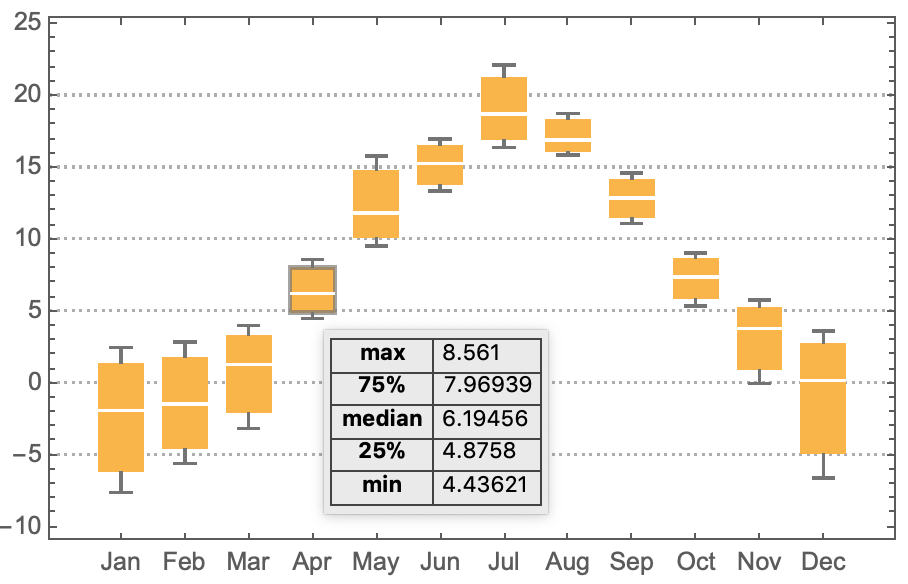
and visualize as a BoxWhiskerChart
BoxWhiskerChart[minMaxMean, ChartLabels -> Automatic, PlotTheme -> "Detailed"]
