Message Boards Message Boards

0
|
14523 Views
|
8 Replies
|
6 Total Likes
View groups...
Share
Share this post:

Plot a Dirac Delta Function?

Good Evening All, I have stumbled across a Dirac Delta Function, when applying the Fourier Transform to a function. I am not quite sure how to plot it. Could anyone provide some guidance? Thanks!

F[t_] := A*Sin[ t]
g[k_] := FourierTransform[F[t], t, k]
I A Sqrt[\[Pi]/2] DiracDelta[-1 + k] - 
 I A Sqrt[\[Pi]/2] DiracDelta[1 + k
POSTED BY: Luciano Pinheiro
8 Replies

Love the analogy, David! And that's an elegant solution to my problem, based on the definition of the the Delta Func, because however the delta func is undefined when its argument is zero, the its integral is well defined by definition. thanks!

POSTED BY: Luciano Pinheiro
Posted 5 years ago

The Dirac delta function is a Monster. It must be kept in a cage, called an integrand. Outside the cage, it makes no more sense than the Jabberwock. Inside the cage it may be tamed:

Integrate[DiracDelta[x - a] f[x],
 {x, -Infinity, Infinity},
 Assumptions -> Element[a, Reals]]
(* f[a] *)
POSTED BY: David Keith

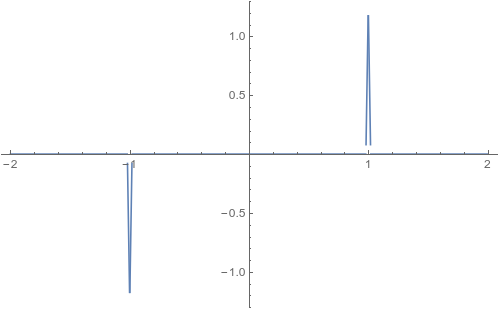
To be honest, I would be quite unhappy if a plot of DiracDelta would actually show anything! What you can do is making something visible by showing its convolution with some "sharp" function, e.g.:

f[t_] := a Sin[t]
g[\[FormalK]_] = FourierTransform[f[\[FormalT]], \[FormalT], \[FormalK]];

plotDelta[f_, k_] := Total@*ReIm@Convolve[f[\[FormalX]], HeavisideLambda[50 \[FormalX]], \[FormalX], k]
Plot[Evaluate[plotDelta[g, k] /. a -> 1], {k, -2, 2}, PlotRange -> All]

which gives:

enter image description here

POSTED BY: Henrik Schachner

https://en.wikipedia.org/wiki/Distribution_(mathematics)

Check the part about linear functionals.

POSTED BY: Daniel Lichtblau

That’s it! Thanks! It’s undefined at zero so we gotta approximate, makes sense. Thanks!!

POSTED BY: Luciano Pinheiro

Delta Function is a generalized function, not a functional bud. But thanks anyways

POSTED BY: Luciano Pinheiro

You can approximate it.

Plot[PDF[NormalDistribution[0, 10^-2], x], {x, -2, 2}, 
 PlotRange -> {0, 1}]

enter image description here

POSTED BY: Frank Kampas

It's really a functional, not a function. There is no reason to expect one could "plot" it in the usual sense.

POSTED BY: Daniel Lichtblau
Reply to this discussion
Community posts can be styled and formatted using the Markdown syntax.
Reply Preview
Attachments
Remove
or Discard

Group Abstract Group Abstract