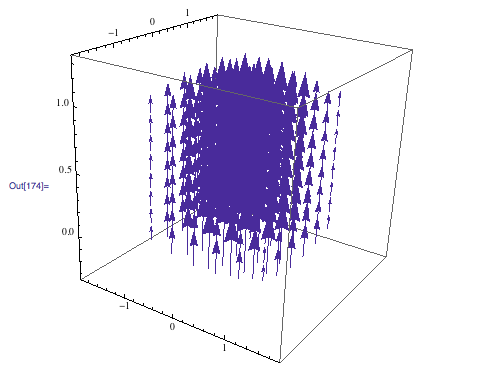
I'm trying to visualize a vector field, but it's very crowded.
VectorPlot3D[{0, 0,
Cos[x] Cos[y]}, {x, -\[Pi]/2, \[Pi]/2}, {y, -\[Pi]/2, \[Pi]/2}, {z,
0, 1}]
In order to make it look less crowded, I'd like to see only one plane of vectors, say for the plane z=0. I've tried using the VectorPoints option, but I can't specify an integer lower than 2 (I'd prefer 1) for my plot because of the error below.
VectorPlot3D[{0, 0,
Cos[x] Cos[y]}, {x, -\[Pi]/2, \[Pi]/2}, {y, -\[Pi]/2, \[Pi]/2}, {z,
0, 1}, VectorPoints -> {10, 10, 1}]
VectorPlot3D::ppts: Value of option PlotPoints -> {10,10,1} is not an integer >= 2. >>
Instead, I'm forced into the following, which gives me 2 planes of vectors when I only want 1 (although it
is slightly clearer). Any thoughts? I thought of reverting to 2D, but that is tricky because there is no x,y component for either of the vectors, for which the magnitude depends only on x and y.
VectorPlot3D[{0, 0,
Cos[x] Cos[y]}, {x, -\[Pi]/2, \[Pi]/2}, {y, -\[Pi]/2, \[Pi]/2}, {z,
0, 1}, VectorPoints -> {10, 10, 2}]
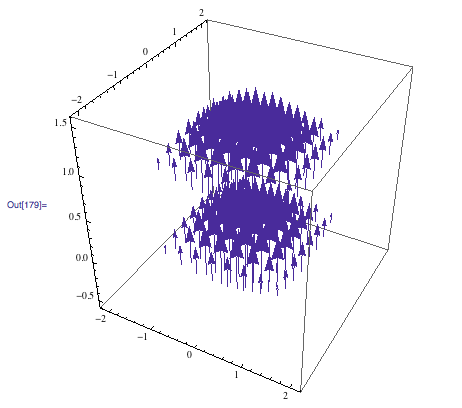
How can I get rid of all but one of the planes of vectors?


