Message Boards Message Boards

0
|
22240 Views
|
3 Replies
|
3 Total Likes
View groups...
Share
Share this post:

Finding area of a region with Mathematica

Posted 11 years ago
Hi my name is Jessica and I have what seems like it should be a very simple question. I am a student in calculus 1 where our professor is having us experiment with Mathematica. We have a short set of problems in which we have to just prove we can enter in information into Mathematica and get an answer. It's really just a way for us to experience calculations other than by hand and the TI-89. However, due to my lack of using Mathematica and understanding how to input information I am having trouble figuring out how to even simply enter information into the program.

The question states: Sketch the region that is bounded by the graphs of f(x) = x e^-x^2, y=0, 0 less than or equal to x less than or equal to 1 and find the area of the region. How would I even go about entering this into Mathematica? I am trying to understand the plot function to view the graph, but am having trouble even figuring out basic input output answers. I'm assuming there should be a place for inserting plot into the input and entering the variable, min & max? If someone could help me that would be great! Thanks!
POSTED BY: Jessica Blanton
3 Replies
bounded by the graphs of f(x)=xe^-x^2, y=0, 0 less than or equal to x les than or equal to 1

Hard to decode the above. Could you paste a screen shot of the question as it is written in the book?
You can plot f(x) itself along with y=x as follows
f[x_] := x Exp[-x^2];
Plot[{f[x], x}, {x, 0, 1}]

If you want the area between the line and f(x) in the above, then do
Integrate[x - f[x], {x, 0, 1}]
N[%]
(* 0.183939720585721 *)
POSTED BY: Nasser M. Abbasi
Posted 11 years ago
 

I did the second part like this - I'm not sure if that's right either:
POSTED BY: Jessica Blanton
Posted 11 years ago
Part 2 looks ok to me
 Clear[f, x, g]; {f, g} = {1/(1 + x^2), x^2/
 
   2}; p = {#, f /. x -> #} & /@ (x /. NSolve[f == g, x, Reals]);
 p = First /@ p; area = NIntegrate[f - g, {x, p[[1]], p[[2]]}];
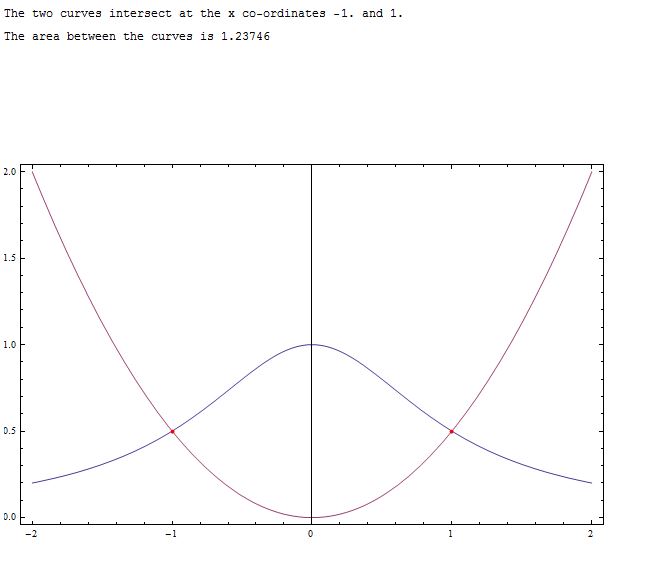
 Print["The two curves intersect at the x co-ordinates ", p[[1]],
   " and ", p[[2]]];
 Print["The area between the curves is ", area]; Plot[{f, g}, {x,
   p[[1]] - 1, p[[2]] + 1},
  Epilog -> {PointSize[0.007],
   Red, (Point[{#, f /. x -> #}] &) /@ (x /.
      NSolve[f == g, x, Reals])}, ImageSize -> {600, 600},
Frame -> True]

POSTED BY: Paul Cleary
Reply to this discussion
Community posts can be styled and formatted using the Markdown syntax.
Reply Preview
Attachments
Remove
or Discard

Group Abstract Group Abstract