Dear Henrik,
Many thanks again. I used coordinates tools for the map and extracted (x,y) coordinates as below.
I appreciate you really.
data = {{69.94439117929088`, 530.9875359539778`}, {63.58581016299169`,
518.2703739213795`}, {61.99616490891691`,
507.1428571428559`}, {58.81687440076732`,
492.8360498561828`}, {58.81687440076732`,
478.5292425695097`}, {52.45829338446816`,
467.4017257909861`}, {46.09971236816898`,
446.7363374880139`}, {58.81687440076732`,
443.55704697986425`}, {61.99616490891691`,
443.55704697986425`}, {69.94439117929088`,
424.48130393096676`}, {60.4065196548421`,
405.40556088206927`}, {54.047938638542945`,
395.8676893576204`}, {61.99616490891691`,
383.15052732502215`}, {69.94439117929088`,
373.6126558005734`}, {79.48226270373962`,
364.07478427612466`}, {90.60977948226318`,
357.7162032598254`}, {98.55800575263714`,
349.7679769894514`}, {108.09587727708586`,
338.6404602109279`}, {120.81303930968423`,
330.69223394055393`}, {133.5302013422826`,
322.74400767018005`}, {139.88878235858172`,
319.56471716203043`}, {152.6059443911801`,
306.84755512943207`}, {160.55417066155402`,
298.8993288590581`}, {163.73346116970365`,
294.1303930968337`}, {162.14381591562884`,
283.0028763183102`}, {147.83700862895572`,
278.2339405560858`}, {138.29913710450697`,
263.9271332694127`}, {122.40268456375904`,
254.38926174496396`}, {108.09587727708586`,
255.9789069990387`}, {93.78906999041274`,
260.7478427612631`}, {73.12368168744047`,
262.33748801533784`}, {58.81687440076732`,
271.8753595397867`}, {34.97219558964542`,
273.46500479386145`}, {22.255033557047085`,
255.9789069990387`}, {11.127516778523557`,
244.8513902205152`}, {11.127516778523557`,
230.5445829338421`}, {19.075743048897493`,
208.28954937679498`}, {25.434324065196677`,
192.393096836047`}, {44.5100671140942`,
189.2138063278975`}, {68.35474592521606`,
179.67593480344863`}, {81.0719079578144`,
168.54841802492513`}, {96.96836049856233`,
162.189837008626`}, {120.81303930968423`,
155.83125599232676`}, {141.47842761265653`,
147.88302972195288`}, {154.1955896452549`,
139.9348034515789`}, {170.09204218600277`,
135.1658676893545`}, {174.8609779482272`,
125.62799616490577`}, {170.09204218600277`,
108.14189837008303`}, {168.50239693192802`,
89.06615532118553`}, {171.68168744007758`,
65.22147651006367`}, {176.45062320230195`,
76.34899328858717`}, {189.16778523490032`,
74.75934803451241`}, {206.653883029723`,
73.16970278043755`}, {213.0124640460222`,
71.5800575263628`}, {220.96069031639618`,
63.6318312559888`}, {238.44678811121886`,
55.68360498561481`}, {254.3432406519668`,
46.14573346116606`}, {267.06040268456513`,
36.60786193671731`}, {281.36720997123825`,
52.5043144774653`}, {300.44295302013575`,
58.86289549376443`}, {316.33940556088373`,
63.6318312559888`}, {333.8255033557065`,
55.68360498561481`}, {375.1562799616511`,
36.60786193671731`}, {349.72195589645435`,
47.73537871524093`}, {365.61840843720233`,
35.01821668264256`}, {387.87344199424945`,
28.659635666343434`}, {405.3595397890721`,
20.71140939596944`}, {418.07670182167044`,
23.89069990411906`}, {432.38350910834356`,
14.352828379670314`}, {470.53499520613866`,
9.583892617445827`}, {486.43144774688653`,
11.173537871520693`}, {492.79002876318566`,
15.942473633745067`}, {505.507190795784`,
19.121764141894687`}, {518.2243528283824`,
35.01821668264256`}, {534.1208053691303`,
33.42857142856781`}, {538.8897411313546`,
44.55608820709131`}, {532.5311601150555`,
58.86289549376443`}, {530.9415148609808`,
76.34899328858717`}, {534.1208053691303`,
89.06615532118553`}, {538.8897411313546`,
97.01438159155941`}, {543.658676893579`,
101.7833173537839`}, {557.9654841802522`,
106.55225311600827`}, {569.0930009587757`,
119.26941514860653`}, {573.8619367210001`,
131.9865771812049`}, {578.6308724832245`,
143.1140939597285`}, {596.1169702780472`,
144.70373921380326`}, {607.24`, 139.93`}, {618.3720038350943`,
127.21764141898052`}, {629.4995206136178`,
116.09012464045702`}, {635.8581016299171`,
116.09012464045702`}, {646.9856184084406`,
116.09012464045702`}, {650.1649089165902`,
116.09012464045702`}, {661.2924256951137`,
112.9108341323074`}, {667.6510067114128`,
98.60402684563428`}, {681.9578139980861`,
90.65580057526029`}, {686.7267497603104`,
76.34899328858717`}, {693.0853307766096`,
66.81112176413842`}, {701.0335570469836`,
69.99041227228804`}, {707.3921380632827`,
76.34899328858717`}, {720.109300095881`,
79.52828379673679`}, {724.8782358581054`,
89.06615532118553`}, {731.2368168744046`,
93.8350910834099`}, {740.7746883988533`,
108.14189837008303`}, {745.5436241610777`,
124.0383509108309`}, {758.260786193676`,
133.57622243527965`}, {766.20901246405`,
146.293384467878`}, {774.157238734424`,
159.01054650047638`}, {780.5158197507232`,
179.67593480344863`}, {794.8226270373963`,
192.393096836047`}, {802.7708533077703`,
209.87919463086973`}, {809.1294343240694`,
222.5963566634681`}, {807.5397890699946`,
236.90316395014122`}, {799.5915627996206`,
265.51677852348746`}, {794.8226270373963`,
273.46500479386145`}, {794.8226270373963`,
286.1821668264598`}, {786.8744007670223`,
300.48897411313294`}, {780.5158197507232`,
303.66826462128245`}, {774.157238734424`,
305.2579098753573`}, {761.4400767018257`,
311.61649089165644`}, {750.312559923302`,
316.3854266538808`}, {734.4161073825542`,
325.92329817832956`}, {723.2885906040307`,
332.2818791946288`}, {712.1610738255071`,
340.2301054650027`}, {702.6232023010583`,
344.99904122722705`}, {693.0853307766096`,
349.7679769894514`}, {683.5474592521608`,
359.3058485139003`}, {680.3681687440112`,
364.07478427612466`}, {669.2406519654877`,
370.4333652924238`}, {653.3441994247397`,
389.5091083413213`}, {659.702780441039`,
381.5608820709473`}, {642.2166826462162`,
400.6366251198449`}, {626.3202301054682`,
411.7641418983684`}, {621.5512943432439`,
414.943432406518`}, {618.3720038350943`,
419.7123681687424`}, {613.60306807287`,
424.48130393096676`}, {607.2444870565707`,
432.42953020134064`}, {600.8859060402716`,
438.7881112176399`}, {589.758389261748`,
448.3259827420886`}, {573.8619367210001`,
449.9156279961634`}, {565.9137104506261`,
467.4017257909861`}, {551.606903163953`,
486.4774688398836`}, {534.1208053691303`,
494.4256951102576`}, {522.9932885906068`,
502.37392138063154`}, {516.6347075743076`,
511.9117929050803`}, {507.0968360498589`,
521.4496644295291`}, {497.55896452541003`,
532.5771812080526`}, {486.43144774688653`,
543.7046979865761`}, {478.48322147651254`,
556.4218600191746`}, {464.1764141898394`,
567.5493767976981`}, {459.40747842761505`,
581.8561840843712`}, {449.8696069031663`,
591.3940556088199`}, {443.5110258868672`,
599.3422818791939`}, {438.7420901246428`,
605.7008628954931`}, {430.7938638542688`,
618.4180249280914`}, {426.02492809204443`,
634.3144774688394`}, {418.07670182167044`,
648.6212847555125`}, {413.31`, 659.75`}, {405.3595397890721`,
675.6452540747839`}, {405.3595397890721`,
686.7727708533075`}, {392.6423777564738`,
699.4899328859058`}, {387.87344199424945`,
715.3863854266538`}, {378.3355704698007`,
728.1035474592521`}, {365.61840843720233`,
729.6931927133269`}, {349.72195589645435`,
723.3346116970278`}, {337.004793863856`,
720.1553211888781`}, {325.8772770853325`,
716.9760306807286`}, {319.51869606903324`,
707.4381591562798`}, {305.2118887823601`,
705.848513902205`}, {295.6740172579114`,
699.4899328859058`}, {284.5465004793879`,
694.7209971236814`}, {271.8293384467895`,
682.0038350910831`}, {262.29146692234076`,
678.8245445829335`}, {244.80536912751805`,
678.8245445829335`}, {230.49856184084493`,
678.8245445829335`}, {222.55033557047093`,
677.2348993288588`}, {214.602109300097`,
672.4659635666344`}, {209.83317353787263`,
659.748801534036`}, {198.70565675934907`,
645.4419942473628`}, {190.75743048897507`,
635.904122722914`}, {176.45062320230195`,
627.9558964525402`}, {170.09204218600277`,
616.8283796740166`}, {163.73346116970365`,
607.2905081495678`}, {147.83700862895572`,
605.7008628954931`}, {143.06807286673134`,
596.1629913710443`}, {149.42665388303047`,
588.2147651006703`}, {160.55417066155402`,
583.445829338446`}, {158.96452540747927`,
565.9597315436233`}, {152.6059443911801`,
546.8839884947258`}, {143.06807286673134`,
538.9357622243517`}, {135.11984659635735`,
532.5771812080526`}, {114.45445829338504`,
534.1668264621273`}, {100.14765100671192`,
530.9875359539778`}, {89.02013422818837`,
535.7564717162022`}, {79.48226270373962`,
537.346116970277`}, {66.76510067114128`, 537.346116970277`}};
poly = ConvexHullMesh@data
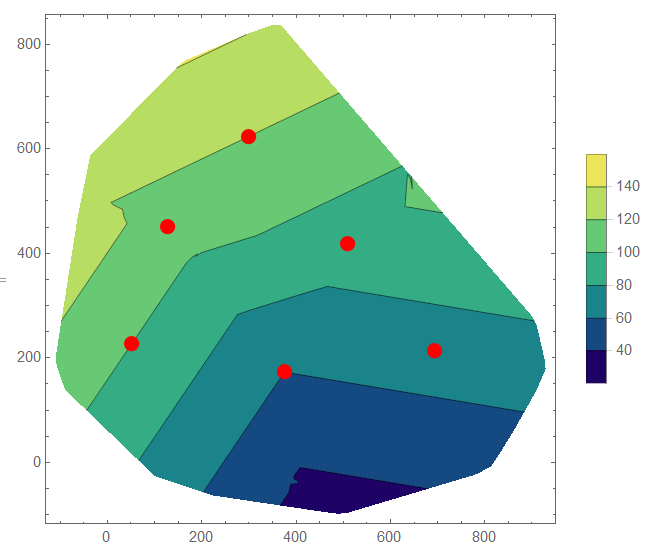
xData = {52, 128, 300, 375, 510, 693}
yData = {228, 451, 624, 173, 419, 214}
zValues = {100, 110, 120, 60, 90, 70}
fT = Quiet@Interpolation[data, InterpolationOrder -> 1]
polyS = RegionResize[poly, Scaled[1.3]];
ContourPlot[fT[x, y], {x, y} \[Element] polyS,
 ColorFunction -> "BlueGreenYellow", PlotLegends -> Automatic,
 Epilog -> {Red, PointSize[.03], Point[Thread[{xData, yData}]]}]