Group Abstract Group Abstract

Message Boards Message Boards

Use the GraphData to draw graphs

Posted 6 years ago

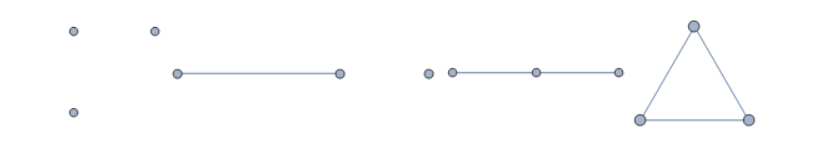
Hello everyone; As the function of GraphData[3] executes, outputs the results shown below

 GraphData[3]
 {{"Empty", 3}, "P2+K1", {"Path", 3}, "TriangleGraph"}}

How to present these graphs of list of above? Just like following graphs:

enter image description here

Thanks in advance for your help !

POSTED BY: Licheng Zhang
2 Replies
Posted 6 years ago

Thank you for your generous help.

POSTED BY: Licheng Zhang

It looks like 3 is a class of graphs in GraphData, and so GraphData[3] returns the list of entities in that class. "P2+K1" is an actual graph entity, and GraphData["P2+K1"] gives its graph:

enter image description here

To get all of the graphs in the class you can use Map,

Map[GraphData, GraphData[3]]

enter image description here

POSTED BY: Jason Biggs
Reply to this discussion
Community posts can be styled and formatted using the Markdown syntax.
Reply Preview
Attachments
Remove
or Discard