Message Boards Message Boards

Plot solutions to a differential sys with initial conditions from loop?

Posted 5 years ago

I have been working with potentially chaotic systems and it would be extremely helpful if I could plot many solutions to the equation starting from different initial conditions on the same graph. What I tried to do was create a loop that picks a starting value for each equation on the system and plots a new solution as the loop iterates, but my basic knowledge of this program failed to produce anything that worked:

a = .1
M = .2
J = .1

For[i = 0, i < M, i += J, 
 For[u = 0, u < M, u += J, For[o = 0; o < M , o += J, 

   {x[][t], y[][t], z[][t]} /. sol2

       sol2 = 
    ParametricNDSolve[{x'[t] == (Sin[y[t]] - b*x[t])*
         Cos[t]*(-Sin[t]*
            Cos[ArcTan[a*t]] + (a*Cos[t]*(-Sin[ArcTan[a*t]]))/(1 + 
              a*t^2)), 

       y'[t] == (Sin[x[t]] - b*z[t])*
         Sin[t]* (Cos[t]*
            Cos[ArcTan[a*t]] + (a*Sin[t]*(-Sin[ArcTan[a*t]]))/(1 + 
              a*t^2) ),

       z'[
         t] == (Sin[z[t]] - 
           b*y[t])*((-Cos[ArcTan[a*t]]*a)/(1 + a*t^2)),

        x[0] == i, y[0] == u, z[0] == o}, {x, y, z}, {t, -100, 
       100}, {a}]

     ParametricPlot3D[
      Evaluate[{x[.1][t], y[.1][t], z[.1][t]} /. sol2], {t, -100, 
       100}, PlotRange -> All, BoxRatios -> {1, 1, 1}, 
      PlotStyle -> Tube[.0005]]]]]

Obviously, my coding is by no means elegant let alone functional but the idea was that M and J would determine how many plots the system would run. Basically, what I have is a mess and was hoping someone could help me out.

POSTED BY: Michael Solomon
3 Replies

Michael,

ParametricNDSolve already does much of what you want. You first need to clear out values you previously set

Clear[a, b, i, u, o]

Solve your problem:

sol = ParametricNDSolve[{x'[t] == (Sin[y[t]] - b*x[t])*
     Cos[t]*(-Sin[t]*
        Cos[ArcTan[a*t]] + (a*Cos[t]*(-Sin[ArcTan[a*t]]))/(1 + 
          a*t^2)), 
   y'[t] == (Sin[x[t]] - b*z[t])*
     Sin[t]*(Cos[t]*
        Cos[ArcTan[a*t]] + (a*Sin[t]*(-Sin[ArcTan[a*t]]))/(1 + 
          a*t^2)), 
   z'[t] == (Sin[z[t]] - b*y[t])*((-Cos[ArcTan[a*t]]*a)/(1 + a*t^2)), 
   x[0] == i, y[0] == u, z[0] == o}, {x, y, z}, {t, -100, 100}, {a, b,
    i, u, o}] 

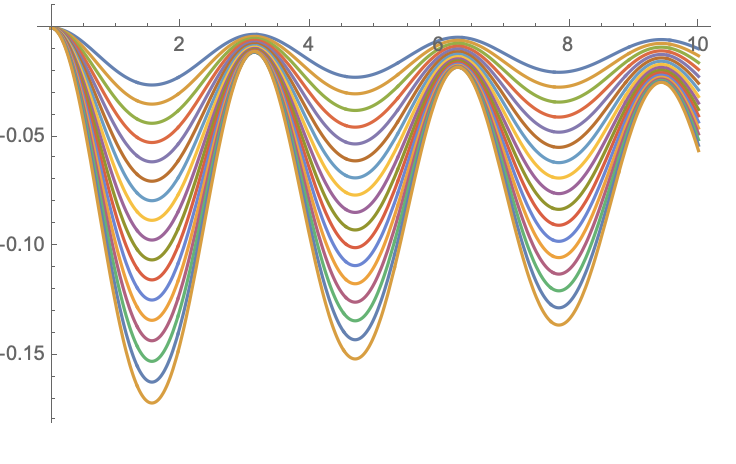
I chose a,b,i,u,o as parameters, you should probably narrow that list. You can now plot results. I do not understand what you want to show exactly so I made up a plot:

Plot[Evaluate@
  Table[Tooltip[y[.1, 0.2, 0, 0, s][t] /. sol, s], {s, 0.3, 1.9, 
    0.1}], {t, 0, 10}]

The mouse will give you the parameter value. You can forego the tooltip and make a grid of plots or any other format.

enter image description here

Regards,

Neil

POSTED BY: Neil Singer

Also, I would avoid using For loops for what you are doing and get in the habit of using Table and list-based methods.

POSTED BY: Neil Singer

The plot is supposed to show many different 3D solutions to the differential equation, so I figure your solution would work if it instead used ParametricPlot3D

POSTED BY: Michael Solomon
Reply to this discussion
Community posts can be styled and formatted using the Markdown syntax.
Reply Preview
Attachments
Remove
or Discard

Group Abstract Group Abstract