Click on the image to zoom in. Press browser back button to return to reading. Download code notebook at the end.
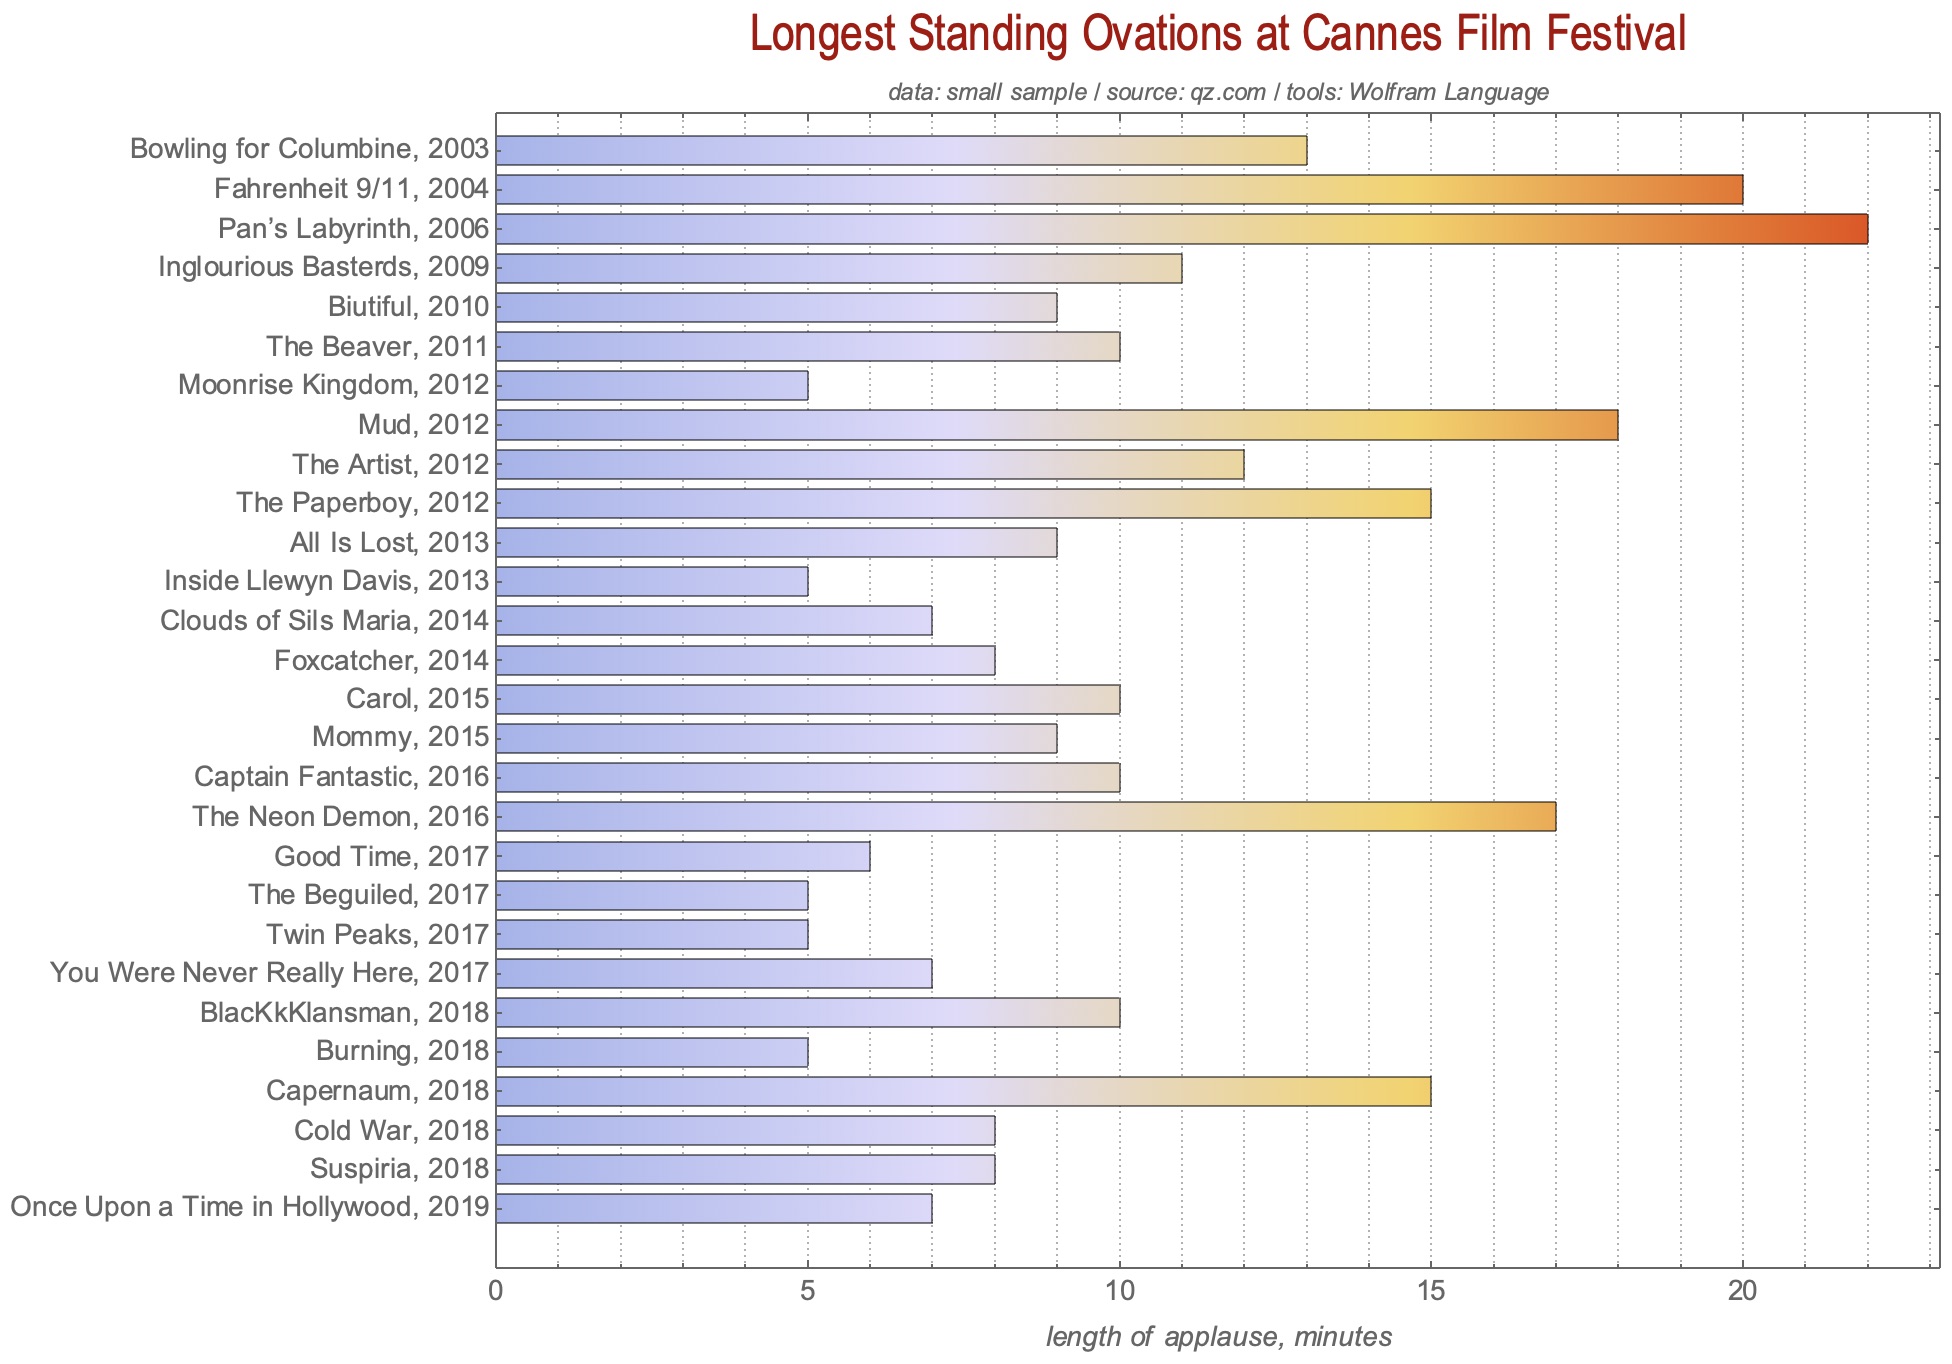
I was astounded to learn that standing ovations at Cannes Film Festival can last more than 20 minutes with key cast members standing as the recipients, probably torn between contradictory "the longer the grander" and "let's end this awkwardness". So that is why Quartzy article I was reading was titled "Quentin Tarantino's new film got a 7-minute applause at Cannes. That's actually not that good." That made me smile. By the way they were talking about 2019 Tarantino's "Once Upon a Time in Hollywood" that I am really looking forward watching. The article mentioned that "the Cannes tradition of overlong standing ovations is as uncomfortable as it is bizarre. And it gets a lot worse than seven minutes." The author Adam Epstein tried searching online news for some of the longest standing ovations in Cannes history. The resulting data is just a small sample obviously, but still fun to look at. In the article there was only the table and I thought it would be nice to visualize it with chart you can see above. That allowed me to choose chronological order as opposed to order-by-time, --- because visually one can easily locate the longest applause.
Let's reproduce the making of the chart now. Start from importing raw data:
raw = Import["https://wolfr.am/DLGvDur1", "Data"];
and cleaning them up a bit, mostly transforming strings to numerical values and sorting chronologically:
clean=
ReverseSortBy[
    MapAt[ToExpression[StringCases[#,DigitCharacter..]][[1]]&,#,3]&/@
    raw[[2,2;;]][[1]],
#[[2]]&]
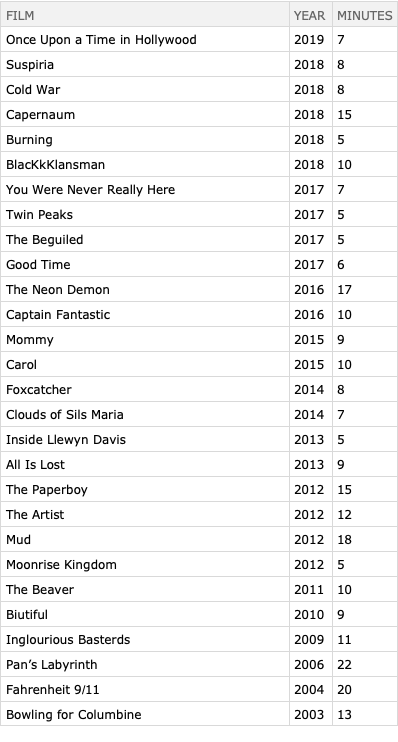
We can see the table easily via Dataset:
Dataset`$DatasetTargetRowCount=Infinity;
Dataset[clean][All,<|"FILM"->1,"YEAR"->2,"MINUTES"->3|>]
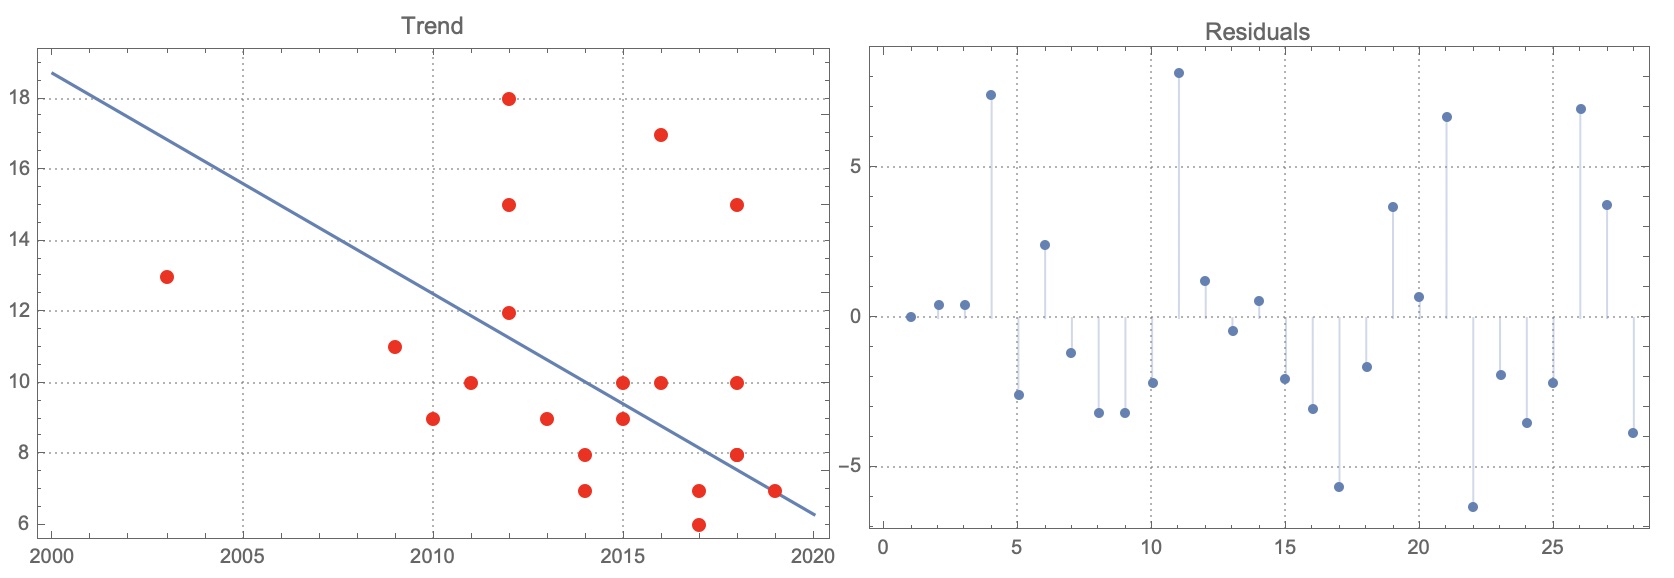
A noticeable trend that can be seen on the top chart is decrease in duration of longest applause with years. Let's take a more careful look at the chronology of the data. Get the year-minutes pairs:
data = clean[[All, 2 ;;]];
and lets speculate that in some rough approximation this falling trend is linear:
lm = LinearModelFit[data, x, x]; lm[x]
1259.61 - 0.620444 x
This means that every year since 2003 the maximum duration of applause was dropping roughly by half a minute:
$$60sec*0.62 =37.2sec$$
This is obviously not entirely correct, because there is some sort of saturation at 5 minutes duration. Looks like the folks at Cannes refuse to give longest applause shorter than 5 minutes ;-). But it is still nice to play with math and fits and get rough numbers. We can visualize this rough trend as:
Row[{
Plot[lm[x],{x,2000,2020},PlotTheme->"Detailed",PlotLabel->"Trend",
    Epilog->{Red,PointSize[Large],Point[data]},PlotLegends->None],
ListPlot[lm["FitResiduals"], Filling->Axis,PlotTheme->"Detailed",
    PlotLabel->"Residuals"]
}]
Now to plot the top chart, - the last step is simple and gets more complex only due to various styling options:
BarChart[clean[[All,3]],
    ChartLabels->label,BarOrigin->Left,
    AspectRatio->.8,PlotTheme->"Detailed",
    ChartElementFunction->"GradientScaleRectangle",
    FrameLabel->{None,Style["length of applause, minutes",Italic]},
    BaseStyle->14,GridLines->{All,None},ImageSize->900,
    PlotLabel->Column[{
Style["Longest Standing Ovations at Cannes Film Festival",Darker[Red],
25,FontFamily->"Arial Narrow"],
Style["data: small sample / source: qz.com / tools: Wolfram Language",12,Italic]},
Alignment->Center]]
 Attachments:


