Message Boards Message Boards

1
|
6449 Views
|
6 Replies
|
1 Total Likes
View groups...
Share
Share this post:

Plot array of geolocated data on a world map?

Posted 5 years ago

I'm trying to overlay LEO sensor data on maps from GeoGraphics. The data is an array of radiances (~ 6K x 6K) which has been geolocated, i.e. each point in the array has an associated lat/lon.

Is it possible to create a geographic entity out of the LEO data and location, and give that to GeoGraphics? Or is there a better approach?

I think I'm looking for something that, if it existed, would be called GeoArrayPlot[].

Thank you.

POSTED BY: Vincent Virgilio
6 Replies

I'm not being clear.

It's the other way around. I want to draw the VIIRS image on a GeoGraphics object, according to the lat/lon array for the VIIRS pixels.

POSTED BY: Vincent Virgilio
Posted 5 years ago

You never mentioned that requirement. As long as you know the geo bounding box of the image, use the method in my previous reply to select the points within that rectangle and then

image = Import["~/Downloads/VIIRS-I5.png"];
GeoListPlot[selected, GeoBackground -> GeoStyling[{"Image", image}]]

enter image description here

POSTED BY: Rohit Namjoshi

Alas, I really need to overlay an image (again, with a corresponding array of geopositions), such as this...

enter image description here

POSTED BY: Vincent Virgilio
Posted 5 years ago

I have run into the same issue when dealing with a large number of points. Filtering using GeoWithinQ is slow because it hits Wolfram's servers and will also fail for a large number of points. Filtering using GeoGridRange is also very slow. Outline of a workaround that I use.

geoPositions = RandomGeoPosition[Entity["Country", "UnitedStates"], 1000];

positions = geoPositions /. GeoPosition[p_] -> p; (* Extract coordinates *)

bounds = CoordinateBounds[positions]; (* Bounding box *)

(* Divide bounding box *)
lats = FindDivisions[First@bounds, 6];
longs = FindDivisions[Last@bounds, 6];

(* Subdivided bounding boxes *)    
grid = Table[{i, j}, {i, lats}, {j, longs}]; 

(* Rectangle for one subdivision *)
section = Rectangle[{35, -110}, {40, -100}];

(* Select positions in the rectangle *)    
selected = GeoPosition@Select[positions, RegionMember[section, #] &]

GeoListPlot[selected, 
 GeoBackground -> GeoStyling["SatelliteWithLabels"], GeoServer -> "DigitalGlobe"]

enter image description here

POSTED BY: Rohit Namjoshi

Thank you Rohit. Your suggestions produce some interesting results. However, I find that I have to significantly decimate my data, otherwise neither function returns. Unfortunately, this obscures the nature of the imagery.

I notice GeoStyling["Satellite"] returns an Image[] with geographical metadata. The metadata specifies a lat/lon region. I wonder if an array of positions can be shoehorned into that.

POSTED BY: Vincent Virgilio
Posted 5 years ago

Vincent,

You could use GeoRegionValuePlot or GeoListPlot. e.g.

data = {{28.3861, -81.4824, 11.}, {28.3861, -81.4825, 6.}, {28.386, -81.4826, 16.},
{28.3859, -81.4829, 32.}, {28.3858, -81.4832, 43.}, {28.3857, -81.4837, 51.},
{28.3856, -81.4841, 54.}, {28.3855, -81.4846, 54.},{28.3853, -81.4849, 45.},
{28.3852, -81.485, 17.},{28.3852, -81.4849, 16.}, {28.3853, -81.4847, 28.},
{28.3854, -81.4843, 45.}, {28.3855, -81.4838, 56.},{28.3857, -81.4833, 64.},
{28.3858, -81.4827, 72.},{28.386, -81.4821, 78.}, {28.3862, -81.4814, 82.},
{28.3864, -81.4807, 83.}, {28.3866, -81.48, 83.},{28.3868, -81.4793, 85.}};

GeoRegionValuePlot[GeoPosition@*Most@# -> Last@# & /@ data,
 GeoBackground -> "StreetMap",
 GeoProjection -> "Mercator"]
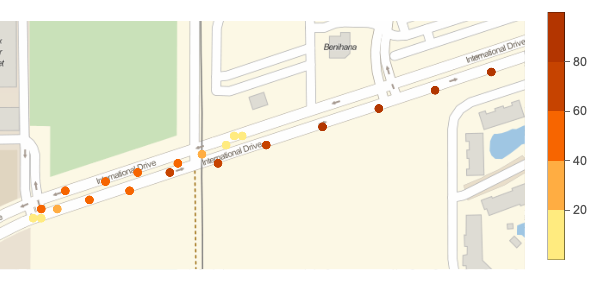
enter image description here

GeoListPlot[
 Style @@@ 
  Transpose[{GeoPosition /@ data[[All, ;; 2]], 
    ColorData["Rainbow"] /@ Rescale[data[[All, -1]]]}], 
 GeoBackground -> "StreetMap", GeoProjection -> "Mercator"]
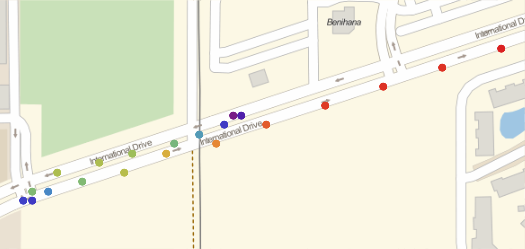
enter image description here

POSTED BY: Rohit Namjoshi
Reply to this discussion
Community posts can be styled and formatted using the Markdown syntax.
Reply Preview
Attachments
Remove
or Discard

Group Abstract Group Abstract