Vincent,
You could use GeoRegionValuePlot or GeoListPlot. e.g.
data = {{28.3861, -81.4824, 11.}, {28.3861, -81.4825, 6.}, {28.386, -81.4826, 16.},
{28.3859, -81.4829, 32.}, {28.3858, -81.4832, 43.}, {28.3857, -81.4837, 51.},
{28.3856, -81.4841, 54.}, {28.3855, -81.4846, 54.},{28.3853, -81.4849, 45.},
{28.3852, -81.485, 17.},{28.3852, -81.4849, 16.}, {28.3853, -81.4847, 28.},
{28.3854, -81.4843, 45.}, {28.3855, -81.4838, 56.},{28.3857, -81.4833, 64.},
{28.3858, -81.4827, 72.},{28.386, -81.4821, 78.}, {28.3862, -81.4814, 82.},
{28.3864, -81.4807, 83.}, {28.3866, -81.48, 83.},{28.3868, -81.4793, 85.}};
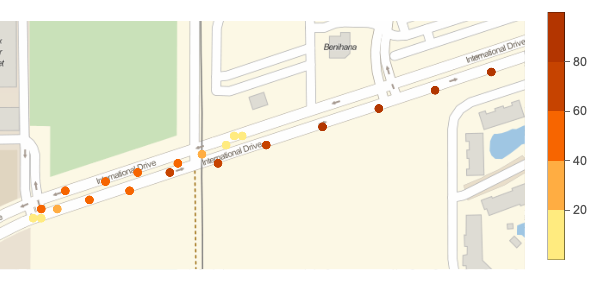
GeoRegionValuePlot[GeoPosition@*Most@# -> Last@# & /@ data,
GeoBackground -> "StreetMap",
GeoProjection -> "Mercator"]
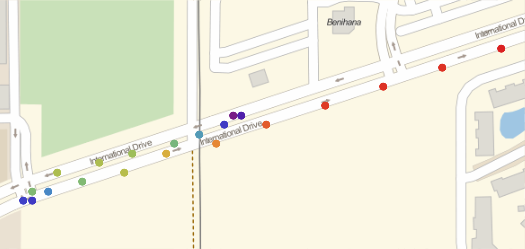
GeoListPlot[
 Style @@@
  Transpose[{GeoPosition /@ data[[All, ;; 2]],
    ColorData["Rainbow"] /@ Rescale[data[[All, -1]]]}],
 GeoBackground -> "StreetMap", GeoProjection -> "Mercator"]