The goal here was to be able to automate some of the data processing to be able to read in new data if the we page changes. Some of the output is there to double check some of the data filters. It's not perfect, but it's what I've got now.
In[1]:= data5 := Import["http://archive.is/4kwbk", "Data"]

In[2]:= data5[[2, 1, 1, 6]]

Out[2]= {"#", "Birthplace", "Name", "Born", "Died", "Age", "Race", "Sex", \
"Deathplace", "When Oldest", "Length of Reign", "Reign Length", "Age at \
Accession", "Case added to GRG Tables"}

In[3]:= data5[[2, 1, 1, 8 ;; 10, 4 ;; 6]] // MatrixForm

Out[3]//MatrixForm= \!\(
TagBox[
RowBox[{"(", "", GridBox[{
{"\<\"Aug. 20, 1842\"\>", "\<\"Oct. 24, 1955\"\>", "113"},
{"\<\"Feb. 11, 1845\"\>", "\<\"Dec. 16, 1956\"\>", "111"},
{"\<\"Jan. 24, 1849\"\>", "\<\"Mar. 30, 1958\"\>", "109"}
},
GridBoxAlignment->{
      "Columns" -> {{Center}}, "ColumnsIndexed" -> {}, "Rows" -> {{Baseline}},
        "RowsIndexed" -> {}},
GridBoxSpacings->{"Columns" -> {
Offset[0.27999999999999997`], {
Offset[0.7]},
Offset[0.27999999999999997`]}, "ColumnsIndexed" -> {}, "Rows" -> {
Offset[0.2], {
Offset[0.4]},
Offset[0.2]}, "RowsIndexed" -> {}}], "", ")"}],
Function[BoxForm`e$,
MatrixForm[BoxForm`e$]]]\)

In[4]:= data5[[2, 1, 1, 8 ;; 10]]

Out[4]= {{1, "England (UK)", "Betsy Baker", "Aug. 20, 1842", "Oct. 24, 1955", 113, 65,
   "W", "F", "U.S. (NE)", "?-1955", "?-113", "N.A.", "N.A.", "N.A.", "N.A.",
  "N.A.", "N.A."}, {2, "England (UK)", "Jennie Howell", "Feb. 11, 1845",
  "Dec. 16, 1956", 111, 309, "W", "F", "U.S. (CA)", "1955-1956", "110-111", 1,
   53, " 1.14", 110, 255, "Aug. 29, 2017"}, {3, "Denmark",
  "Anne Marie Carstenson", "Jan. 24, 1849", "Mar. 30, 1958", 109, 65, "W",
  "F", "U.S. (NE)", "1956-1958", "107-109", 1, 104, " 1.28", 107, 327,
  "N.A. (less than 110)"}}

In[5]:= data5[[2, 1, 1, 9]]

Out[5]= {2, "England (UK)", "Jennie Howell", "Feb. 11, 1845", "Dec. 16, 1956", 111, \
309, "W", "F", "U.S. (CA)", "1955-1956", "110-111", 1, 53, " 1.14", 110, 255, \
"Aug. 29, 2017"}
Remove the space to match up with how Mathematica refers to variables
In[6]:= data6 = StringDelete[data5[[2, 1, 1, 8 ;; 71, 2]], " "]

Out[6]= {"England(UK)", "England(UK)", "Denmark", "U.S.(IN)", "Netherlands", \
"Norway", "U.S.(MI)", "England(UK)", "U.S.(TX)", "England(UK)", \
"England(UK)", "SouthAfrica", "Czechoslovakia", "England(UK)", "Spain", \
"England(UK)", "N.Ireland(UK)", "Japan", "Japan", "U.S.(MO)", "France", \
"U.S.(IL)", "France", "U.S.(NH)", "U.S.(MO)", "U.S.(VA)", \
"Germany(nowPoland)[5]", "U.S.(CA)", "England(UK)", "U.S.(PA)", "France", \
"Canada(Que)", "U.S.(PA)", "England(UK)", "France", "U.S.(MI)", \
"England(UK)", "CapeVerde(Portugal)[8]", "U.S.(NY)", "Japan", "Japan", \
"PuertoRico", "Ecuador", "U.S.(TN)", "PuertoRico", "U.S.(NC)", "Japan", \
"U.S.(IN)", "Portugal", "U.S.(GA)", "Japan", "France", "Brazil", "U.S.(TN)", \
"Italy", "Japan", "Japan", "U.S.(AR)", "U.S.(GA)", "U.S.(AL)", "Italy", \
"BritishWestIndies(nowJamaica)", "Japan", "Japan"}
Double check numbers by eye ... How do we handle U.S. (CA)
In[7]:= StringCases[data5[[2, 1, 1, 8 ;; 71, 2]], "U.S. (" ~~ __ ~~ ")"]

Out[7]= {{}, {}, {}, {"U.S. (IN)"}, {}, {}, {"U.S. (MI)"}, {}, {"U.S. (TX)"}, {}, {}, \
{}, {}, {}, {}, {}, {}, {}, {}, {"U.S. (MO)"}, {}, {"U.S. (IL)"}, {}, {"U.S. \
(NH)"}, {"U.S. (MO)"}, {"U.S. (VA)"}, {}, {"U.S. (CA)"}, {}, {"U.S. (PA)"}, \
{}, {}, {"U.S. (PA)"}, {}, {}, {"U.S. (MI)"}, {}, {}, {"U.S. (NY)"}, {}, {}, \
{}, {}, {"U.S. (TN)"}, {}, {"U.S. (NC)"}, {}, {"U.S. (IN)"}, {}, {"U.S. \
(GA)"}, {}, {}, {}, {"U.S. (TN)"}, {}, {}, {}, {"U.S. (AR)"}, {"U.S. (GA)"}, \
{"U.S. (AL)"}, {}, {}, {}, {}}

In[8]:= Length[Cases[StringCases[data6, "U.S.(" ~~ __ ~~ ")"], Except[{}]]]

Out[8]= 21
Test the case of Puerto Rico - without a space
In[9]:= Length[Cases[data6, "PuertoRico"]]

Out[9]= 2
OK ... Let's do it!
In[10]:= data6

Out[10]= {"England(UK)", "England(UK)", "Denmark", "U.S.(IN)", "Netherlands", \
"Norway", "U.S.(MI)", "England(UK)", "U.S.(TX)", "England(UK)", \
"England(UK)", "SouthAfrica", "Czechoslovakia", "England(UK)", "Spain", \
"England(UK)", "N.Ireland(UK)", "Japan", "Japan", "U.S.(MO)", "France", \
"U.S.(IL)", "France", "U.S.(NH)", "U.S.(MO)", "U.S.(VA)", \
"Germany(nowPoland)[5]", "U.S.(CA)", "England(UK)", "U.S.(PA)", "France", \
"Canada(Que)", "U.S.(PA)", "England(UK)", "France", "U.S.(MI)", \
"England(UK)", "CapeVerde(Portugal)[8]", "U.S.(NY)", "Japan", "Japan", \
"PuertoRico", "Ecuador", "U.S.(TN)", "PuertoRico", "U.S.(NC)", "Japan", \
"U.S.(IN)", "Portugal", "U.S.(GA)", "Japan", "France", "Brazil", "U.S.(TN)", \
"Italy", "Japan", "Japan", "U.S.(AR)", "U.S.(GA)", "U.S.(AL)", "Italy", \
"BritishWestIndies(nowJamaica)", "Japan", "Japan"}

In[11]:= Length[Cases[data5[[2, 1, 1, 8 ;; 71, 2]], "Japan"]]
Length[Cases[data6, "England(UK)"]]
Length[Cases[StringCases[data5[[2, 1, 1, 8 ;; 71, 2]], "U.S. (" ~~ __ ~~ ")"],
    Except[{}]]] + Length[Cases[data5[[2, 1, 1, 8 ;; 71, 2]], "Puerto Rico"]]

Out[11]= 10

Out[12]= 10

Out[13]= 23
Let's figure our how many people are over 100 per capita for different regions of the world.
In[14]:= countriesSA := CountryData["SouthAmerica"]
countriesEU := CountryData["Europe"]
countriesAF := CountryData["Africa"]
countriesAS := CountryData["Asia"]
countriesAU := {CountryData["Australia"], CountryData["NewZealand"],
  CountryData["PapuaNewGuinea"]}
countriesNA := CountryData["NorthAmerica"]

In[20]:= countriesAS[[ ;; ]]

Out[20]= {Entity["Country", "Afghanistan"], Entity["Country", "Armenia"],
 Entity["Country", "Azerbaijan"], Entity["Country", "Bahrain"],
 Entity["Country", "Bangladesh"], Entity["Country", "Bhutan"],
 Entity["Country", "Brunei"], Entity["Country", "Cambodia"],
 Entity["Country", "China"], Entity["Country", "ChristmasIsland"],
 Entity["Country", "CocosKeelingIslands"], Entity["Country", "EastTimor"],
 Entity["Country", "Egypt"], Entity["Country", "GazaStrip"],
 Entity["Country", "Georgia"], Entity["Country", "HongKong"],
 Entity["Country", "India"], Entity["Country", "Indonesia"],
 Entity["Country", "Iran"], Entity["Country", "Iraq"],
 Entity["Country", "Israel"], Entity["Country", "Japan"],
 Entity["Country", "Jordan"], Entity["Country", "Kazakhstan"],
 Entity["Country", "Kuwait"], Entity["Country", "Kyrgyzstan"],
 Entity["Country", "Laos"], Entity["Country", "Lebanon"],
 Entity["Country", "Macau"], Entity["Country", "Malaysia"],
 Entity["Country", "Maldives"], Entity["Country", "Mongolia"],
 Entity["Country", "Myanmar"], Entity["Country", "Nepal"],
 Entity["Country", "NorthKorea"], Entity["Country", "Oman"],
 Entity["Country", "Pakistan"], Entity["Country", "Philippines"],
 Entity["Country", "Qatar"], Entity["Country", "Russia"],
 Entity["Country", "SaudiArabia"], Entity["Country", "Singapore"],
 Entity["Country", "SouthKorea"], Entity["Country", "SriLanka"],
 Entity["Country", "Syria"], Entity["Country", "Taiwan"],
 Entity["Country", "Tajikistan"], Entity["Country", "Thailand"],
 Entity["Country", "Turkey"], Entity["Country", "Turkmenistan"],
 Entity["Country", "UnitedArabEmirates"], Entity["Country", "Uzbekistan"],
 Entity["Country", "Vietnam"], Entity["Country", "WestBank"],
 Entity["Country", "Yemen"]}

In[21]:= countriesAU

Out[21]= {Entity["Country", "Australia"], Entity["Country", "NewZealand"],
 Entity["Country", "PapuaNewGuinea"]}
Set up an array of zeros based on the number of countries in each region.
In[22]:= eu = ConstantArray[0, Length[countriesEU[[;; , 2]]]];
sa = ConstantArray[0, Length[countriesSA[[;; , 2]]]];
af = ConstantArray[0, Length[countriesAF[[;; , 2]]]];
as = ConstantArray[0, Length[countriesAS[[;; , 2]]]];
au = ConstantArray[0, Length[countriesAU[[;; , 2]]]];
na = ConstantArray[0, Length[countriesNA[[;; , 2]]]];

In[28]:= eu

Out[28]= {0, 0, 0, 0, 0, 0, 0, 0, 0, 0, 0, 0, 0, 0, 0, 0, 0, 0, 0, 0, 0, 0, 0, 0, 0, \
0, 0, 0, 0, 0, 0, 0, 0, 0, 0, 0, 0, 0, 0, 0, 0, 0, 0, 0, 0, 0, 0, 0, 0, 0, 0}
Loop over all European countries to count number of people over 100 years old in Europe
In[29]:= countriesEU

Out[29]= {Entity["Country", "Albania"], Entity["Country", "Andorra"],
 Entity["Country", "Austria"], Entity["Country", "Belarus"],
 Entity["Country", "Belgium"], Entity["Country", "BosniaHerzegovina"],
 Entity["Country", "Bulgaria"], Entity["Country", "Croatia"],
 Entity["Country", "Cyprus"], Entity["Country", "CzechRepublic"],
 Entity["Country", "Denmark"], Entity["Country", "Estonia"],
 Entity["Country", "FaroeIslands"], Entity["Country", "Finland"],
 Entity["Country", "France"], Entity["Country", "Germany"],
 Entity["Country", "Gibraltar"], Entity["Country", "Greece"],
 Entity["Country", "Guernsey"], Entity["Country", "Hungary"],
 Entity["Country", "Iceland"], Entity["Country", "Ireland"],
 Entity["Country", "IsleOfMan"], Entity["Country", "Italy"],
 Entity["Country", "Jersey"], Entity["Country", "Kosovo"],
 Entity["Country", "Latvia"], Entity["Country", "Liechtenstein"],
 Entity["Country", "Lithuania"], Entity["Country", "Luxembourg"],
 Entity["Country", "Macedonia"], Entity["Country", "Malta"],
 Entity["Country", "Moldova"], Entity["Country", "Monaco"],
 Entity["Country", "Montenegro"], Entity["Country", "Netherlands"],
 Entity["Country", "Norway"], Entity["Country", "Poland"],
 Entity["Country", "Portugal"], Entity["Country", "Romania"],
 Entity["Country", "SanMarino"], Entity["Country", "Serbia"],
 Entity["Country", "Slovakia"], Entity["Country", "Slovenia"],
 Entity["Country", "Spain"], Entity["Country", "Svalbard"],
 Entity["Country", "Sweden"], Entity["Country", "Switzerland"],
 Entity["Country", "Ukraine"], Entity["Country", "UnitedKingdom"],
 Entity["Country", "VaticanCity"]}

In[30]:= {Length[Cases[StringCases[data6, "England(UK)"]]]} (* without space ?? *)

Out[30]= {1}

In[31]:= Do[eu[[kk]] = Length[Cases[data6, countriesEU[[kk, 2]]]], {kk, 1,
  Length[countriesEU[[;; , 2]]], 1}]

In[32]:= Cases[data6, "England(UK)"]

Out[32]= {"England(UK)", "England(UK)", "England(UK)", "England(UK)", "England(UK)", \
"England(UK)", "England(UK)", "England(UK)", "England(UK)", "England(UK)"}

In[33]:= eu

Out[33]= {0, 0, 0, 0, 0, 0, 0, 0, 0, 0, 1, 0, 0, 0, 5, 0, 0, 0, 0, 0, 0, 0, 0, 2, 0, \
0, 0, 0, 0, 0, 0, 0, 0, 0, 0, 1, 1, 0, 1, 0, 0, 0, 0, 0, 1, 0, 0, 0, 0, 0, 0}

In[34]:= Total[eu]

Out[34]= 12
Loop over all South American countries to count number of people over 100 years old in South America
In[35]:= countriesSA

Out[35]= {Entity["Country", "Argentina"], Entity["Country", "Bolivia"],
 Entity["Country", "Brazil"], Entity["Country", "Chile"],
 Entity["Country", "Colombia"], Entity["Country", "Ecuador"],
 Entity["Country", "FalklandIslands"], Entity["Country", "FrenchGuiana"],
 Entity["Country", "Guyana"], Entity["Country", "Paraguay"],
 Entity["Country", "Peru"], Entity["Country", "Suriname"],
 Entity["Country", "Uruguay"], Entity["Country", "Venezuela"]}

In[36]:= (*Do[sa[[kk]]=Length[Cases[data5[[2,1,1,8;;71,2]],countriesSA[[kk,2]]]],{kk,1,\
Length[countriesSA[[;;,2]]],1}]*)

In[37]:= Do[sa[[kk]] = Length[Cases[data6, countriesSA[[kk, 2]]]], {kk, 1,
  Length[countriesSA[[;; , 2]]], 1}]

In[38]:= sa

Out[38]= {0, 0, 1, 0, 0, 1, 0, 0, 0, 0, 0, 0, 0, 0}

In[39]:= Total[sa]

Out[39]= 2
Loop over all African countries to count number of people over 100 years old in African
In[40]:= countriesAF

Out[40]= {Entity["Country", "Algeria"], Entity["Country", "Angola"],
 Entity["Country", "Benin"], Entity["Country", "Botswana"],
 Entity["Country", "BurkinaFaso"], Entity["Country", "Burundi"],
 Entity["Country", "Cameroon"], Entity["Country", "CapeVerde"],
 Entity["Country", "CentralAfricanRepublic"], Entity["Country", "Chad"],
 Entity["Country", "Comoros"], Entity["Country", "DemocraticRepublicCongo"],
 Entity["Country", "Djibouti"], Entity["Country", "Egypt"],
 Entity["Country", "EquatorialGuinea"], Entity["Country", "Eritrea"],
 Entity["Country", "Ethiopia"], Entity["Country", "Gabon"],
 Entity["Country", "Gambia"], Entity["Country", "Ghana"],
 Entity["Country", "Guinea"], Entity["Country", "GuineaBissau"],
 Entity["Country", "IvoryCoast"], Entity["Country", "Kenya"],
 Entity["Country", "Lesotho"], Entity["Country", "Liberia"],
 Entity["Country", "Libya"], Entity["Country", "Madagascar"],
 Entity["Country", "Malawi"], Entity["Country", "Mali"],
 Entity["Country", "Mauritania"], Entity["Country", "Mauritius"],
 Entity["Country", "Mayotte"], Entity["Country", "Morocco"],
 Entity["Country", "Mozambique"], Entity["Country", "Namibia"],
 Entity["Country", "Niger"], Entity["Country", "Nigeria"],
 Entity["Country", "RepublicCongo"], Entity["Country", "Reunion"],
 Entity["Country", "Rwanda"], Entity["Country", "SaintHelena"],
 Entity["Country", "SaoTomePrincipe"], Entity["Country", "Senegal"],
 Entity["Country", "Seychelles"], Entity["Country", "SierraLeone"],
 Entity["Country", "Somalia"], Entity["Country", "SouthAfrica"],
 Entity["Country", "SouthSudan"], Entity["Country", "Sudan"],
 Entity["Country", "Swaziland"], Entity["Country", "Tanzania"],
 Entity["Country", "Togo"], Entity["Country", "Tunisia"],
 Entity["Country", "Uganda"], Entity["Country", "WesternSahara"],
 Entity["Country", "Zambia"], Entity["Country", "Zimbabwe"]}

In[41]:= (*Do[af[[kk]]=Length[Cases[data5[[2,1,1,8;;71,2]],countriesAF[[kk,2]]]],{kk,1,\
Length[countriesAF[[;;,2]]],1}]*)

In[42]:= Do[af[[kk]] = Length[Cases[data6, countriesAF[[kk, 2]]]], {kk, 1,
  Length[countriesAF[[;; , 2]]], 1}]

In[43]:= af

Out[43]= {0, 0, 0, 0, 0, 0, 0, 0, 0, 0, 0, 0, 0, 0, 0, 0, 0, 0, 0, 0, 0, 0, 0, 0, 0, \
0, 0, 0, 0, 0, 0, 0, 0, 0, 0, 0, 0, 0, 0, 0, 0, 0, 0, 0, 0, 0, 0, 1, 0, 0, 0, \
0, 0, 0, 0, 0, 0, 0}

In[44]:= Total[af]

Out[44]= 1
Loop over all Asian countries to count number of people over 100 years old in Asian
In[45]:= countriesAS

Out[45]= {Entity["Country", "Afghanistan"], Entity["Country", "Armenia"],
 Entity["Country", "Azerbaijan"], Entity["Country", "Bahrain"],
 Entity["Country", "Bangladesh"], Entity["Country", "Bhutan"],
 Entity["Country", "Brunei"], Entity["Country", "Cambodia"],
 Entity["Country", "China"], Entity["Country", "ChristmasIsland"],
 Entity["Country", "CocosKeelingIslands"], Entity["Country", "EastTimor"],
 Entity["Country", "Egypt"], Entity["Country", "GazaStrip"],
 Entity["Country", "Georgia"], Entity["Country", "HongKong"],
 Entity["Country", "India"], Entity["Country", "Indonesia"],
 Entity["Country", "Iran"], Entity["Country", "Iraq"],
 Entity["Country", "Israel"], Entity["Country", "Japan"],
 Entity["Country", "Jordan"], Entity["Country", "Kazakhstan"],
 Entity["Country", "Kuwait"], Entity["Country", "Kyrgyzstan"],
 Entity["Country", "Laos"], Entity["Country", "Lebanon"],
 Entity["Country", "Macau"], Entity["Country", "Malaysia"],
 Entity["Country", "Maldives"], Entity["Country", "Mongolia"],
 Entity["Country", "Myanmar"], Entity["Country", "Nepal"],
 Entity["Country", "NorthKorea"], Entity["Country", "Oman"],
 Entity["Country", "Pakistan"], Entity["Country", "Philippines"],
 Entity["Country", "Qatar"], Entity["Country", "Russia"],
 Entity["Country", "SaudiArabia"], Entity["Country", "Singapore"],
 Entity["Country", "SouthKorea"], Entity["Country", "SriLanka"],
 Entity["Country", "Syria"], Entity["Country", "Taiwan"],
 Entity["Country", "Tajikistan"], Entity["Country", "Thailand"],
 Entity["Country", "Turkey"], Entity["Country", "Turkmenistan"],
 Entity["Country", "UnitedArabEmirates"], Entity["Country", "Uzbekistan"],
 Entity["Country", "Vietnam"], Entity["Country", "WestBank"],
 Entity["Country", "Yemen"]}

In[46]:= (*Do[af[[kk]]=Length[Cases[data5[[2,1,1,8;;71,2]],countriesAF[[kk,2]]]],{kk,1,\
Length[countriesAF[[;;,2]]],1}]*)

In[47]:= Do[as[[kk]] = Length[Cases[data6, countriesAS[[kk, 2]]]], {kk, 1,
  Length[countriesAS[[;; , 2]]], 1}]

In[48]:= as

Out[48]= {0, 0, 0, 0, 0, 0, 0, 0, 0, 0, 0, 0, 0, 0, 0, 0, 0, 0, 0, 0, 0, 10, 0, 0, 0, \
0, 0, 0, 0, 0, 0, 0, 0, 0, 0, 0, 0, 0, 0, 0, 0, 0, 0, 0, 0, 0, 0, 0, 0, 0, 0, \
0, 0, 0, 0}

In[49]:= Total[as]

Out[49]= 10
Loop over all "Australian" countries to count number of people over 100 years old in Australian
In[50]:= countriesAU

Out[50]= {Entity["Country", "Australia"], Entity["Country", "NewZealand"],
 Entity["Country", "PapuaNewGuinea"]}

In[51]:= (*Do[af[[kk]]=Length[Cases[data5[[2,1,1,8;;71,2]],countriesAF[[kk,2]]]],{kk,1,\
Length[countriesAF[[;;,2]]],1}]*)

In[52]:= Do[au[[kk]] = Length[Cases[data6, countriesAU[[kk, 2]]]], {kk, 1,
  Length[countriesAU[[;; , 2]]], 1}]

In[53]:= au

Out[53]= {0, 0, 0}

In[54]:= Total[au]

Out[54]= 0

Gotta do something special for the US

In[55]:= countriesNA

Out[55]= {Entity["Country", "Anguilla"], Entity["Country", "AntiguaBarbuda"],
 Entity["Country", "Aruba"], Entity["Country", "Bahamas"],
 Entity["Country", "Barbados"], Entity["Country", "Belize"],
 Entity["Country", "Bermuda"], Entity["Country", "BritishVirginIslands"],
 Entity["Country", "Canada"], Entity["Country", "CaymanIslands"],
 Entity["Country", "CostaRica"], Entity["Country", "Cuba"],
 Entity["Country", "Curacao"], Entity["Country", "Dominica"],
 Entity["Country", "DominicanRepublic"], Entity["Country", "ElSalvador"],
 Entity["Country", "Greenland"], Entity["Country", "Grenada"],
 Entity["Country", "Guadeloupe"], Entity["Country", "Guatemala"],
 Entity["Country", "Haiti"], Entity["Country", "Honduras"],
 Entity["Country", "Jamaica"], Entity["Country", "Martinique"],
 Entity["Country", "Mexico"], Entity["Country", "Montserrat"],
 Entity["Country", "Nicaragua"], Entity["Country", "Panama"],
 Entity["Country", "PuertoRico"], Entity["Country", "SaintKittsNevis"],
 Entity["Country", "SaintLucia"], Entity["Country", "SaintPierreMiquelon"],
 Entity["Country", "SaintVincentGrenadines"],
 Entity["Country", "SintMaarten"], Entity["Country", "TrinidadTobago"],
 Entity["Country", "TurksCaicosIslands"], Entity["Country", "UnitedStates"],
 Entity["Country", "UnitedStatesVirginIslands"]}
Note ... this does not include United States - due to abbreviation... Had to use "remove space" to handle Puerto Rico ... due to space in country name
In[56]:= Do[na[[jj]] = Length[Cases[data6, countriesNA[[jj, 2]]]], {jj, 1,
  Length[countriesNA[[;; , 2]]], 1}]

In[57]:= na
Total[na]
naOver100 =
 Total[na] +
  Length[Cases[StringCases[data6, "U.S.(" ~~ __ ~~ ")"], Except[{}]]]


Out[57]= {0, 0, 0, 0, 0, 0, 0, 0, 0, 0, 0, 0, 0, 0, 0, 0, 0, 0, 0, 0, 0, 0, 0, 0, 0, \
0, 0, 0, 2, 0, 0, 0, 0, 0, 0, 0, 0, 0}

Out[58]= 2

Out[59]= 23
Get Population Data
In[60]:= SApop := CountryData["SouthAmerica", "Population"]
EUpop := CountryData["Europe", "Population"]
AFpop := CountryData["Africa", "Population"]
ASpop := CountryData["Asia", "Population"]
AUpop := {CountryData["Australia", "Population"],
  CountryData["NewZealand", "Population"],
  CountryData["PapuaNewGuinea", "Population"]}
NApop := CountryData["NorthAmerica", "Population"]

In[66]:= Total[SApop]

Out[66]= Quantity[424393547, "People"]

In[67]:= over100percapita = {{"South America", "Europe", "Africa", "Asia", "Australia",
     "North and Central America"}, {Total[sa]/Total[SApop],
    Total[eu]/Total[EUpop], Total[af]/Total[AFpop], Total[as]/Total[ASpop],
    Total[au]/Total[AUpop], naOver100/Total[NApop]}};

In[68]:= over100percapita // MatrixForm

Out[68]//MatrixForm= \!\(
TagBox[
RowBox[{"(", "", GridBox[{
{"\<\"South America\"\>", "\<\"Europe\"\>", "\<\"Africa\"\>", "\<\"Asia\"\>", \
"\<\"Australia\"\>", "\<\"North and Central America\"\>"},
{
TemplateBox[{
        FractionBox["2", "424393547"],RowBox[{"\"per \"", " ", "\"person\""}],
         "reciprocal people",FractionBox["1", "\"People\""]},
"Quantity"],
TemplateBox[{
        FractionBox["3", "150280378"],RowBox[{"\"per \"", " ", "\"person\""}],
         "reciprocal people",FractionBox["1", "\"People\""]},
"Quantity"],
TemplateBox[{
        FractionBox["1", "1256268024"],
         RowBox[{"\"per \"", " ", "\"person\""}],"reciprocal people",
         FractionBox["1", "\"People\""]},
"Quantity"],
TemplateBox[{
        FractionBox["2", "948873501"],RowBox[{"\"per \"", " ", "\"person\""}],
         "reciprocal people",FractionBox["1", "\"People\""]},
"Quantity"],
TemplateBox[{
        "0",RowBox[{"\"per \"", " ", "\"person\""}],"reciprocal people",
         FractionBox["1", "\"People\""]},
"Quantity"],
TemplateBox[{
        FractionBox["23", "582382049"],
         RowBox[{"\"per \"", " ", "\"person\""}],"reciprocal people",
         FractionBox["1", "\"People\""]},
"Quantity"]}
},
GridBoxAlignment->{
      "Columns" -> {{Center}}, "ColumnsIndexed" -> {}, "Rows" -> {{Baseline}},
        "RowsIndexed" -> {}},
GridBoxSpacings->{"Columns" -> {
Offset[0.27999999999999997`], {
Offset[0.7]},
Offset[0.27999999999999997`]}, "ColumnsIndexed" -> {}, "Rows" -> {
Offset[0.2], {
Offset[0.4]},
Offset[0.2]}, "RowsIndexed" -> {}}], "", ")"}],
Function[BoxForm`e$,
MatrixForm[BoxForm`e$]]]\)

In[69]:= Total[as]

Out[69]= 10

In[70]:= euinfo = ConstantArray[0, Length[data6]];
sainfo = ConstantArray[0, Length[data6]];
afinfo = ConstantArray[0, Length[data6]];
asinfo = ConstantArray[0, Length[data6]];
auinfo = ConstantArray[0, Length[data6]];
nainfo = ConstantArray[0, Length[data6]];

In[76]:= data5[[2, 1, 1, 8 ;; 71, 6]]

Out[76]= {113, 111, 109, 109, 110, 109, 113, 109, 110, 110, 111, 111, 111, 111, 112, \
112, 110, 112, 113, 111, 111, 113, 112, 113, 113, 114, 115, 113, 114, 114, \
122, 117, 119, 114, 115, 115, 114, 114, 113, 114, 114, 114, 116, 116, 115, \
114, 114, 115, 115, 115, 114, 114, 114, 116, 115, 116, 117, 116, 116, 116, \
117, 117, 117, 117}

In[77]:= data6

Out[77]= {"England(UK)", "England(UK)", "Denmark", "U.S.(IN)", "Netherlands", \
"Norway", "U.S.(MI)", "England(UK)", "U.S.(TX)", "England(UK)", \
"England(UK)", "SouthAfrica", "Czechoslovakia", "England(UK)", "Spain", \
"England(UK)", "N.Ireland(UK)", "Japan", "Japan", "U.S.(MO)", "France", \
"U.S.(IL)", "France", "U.S.(NH)", "U.S.(MO)", "U.S.(VA)", \
"Germany(nowPoland)[5]", "U.S.(CA)", "England(UK)", "U.S.(PA)", "France", \
"Canada(Que)", "U.S.(PA)", "England(UK)", "France", "U.S.(MI)", \
"England(UK)", "CapeVerde(Portugal)[8]", "U.S.(NY)", "Japan", "Japan", \
"PuertoRico", "Ecuador", "U.S.(TN)", "PuertoRico", "U.S.(NC)", "Japan", \
"U.S.(IN)", "Portugal", "U.S.(GA)", "Japan", "France", "Brazil", "U.S.(TN)", \
"Italy", "Japan", "Japan", "U.S.(AR)", "U.S.(GA)", "U.S.(AL)", "Italy", \
"BritishWestIndies(nowJamaica)", "Japan", "Japan"}
Average Age For Europe
In[78]:= Do[
 Do[
  If[data6[[kk]] == countriesEU[[jj, 2]], euinfo[[kk]] = 1], {kk, 1,
   Length[data6], 1}
  ], {jj, 1, Length[countriesEU[[;; , 2]]], 1}
 ]

In[79]:= euinfo
data5[[2, 1, 1, 8 ;; 71, 6]]

Out[79]= {0, 0, 1, 0, 1, 1, 0, 0, 0, 0, 0, 0, 0, 0, 1, 0, 0, 0, 0, 0, 1, 0, 1, 0, 0, \
0, 0, 0, 0, 0, 1, 0, 0, 0, 1, 0, 0, 0, 0, 0, 0, 0, 0, 0, 0, 0, 0, 0, 1, 0, 0, \
1, 0, 0, 1, 0, 0, 0, 0, 0, 1, 0, 0, 0}

Out[80]= {113, 111, 109, 109, 110, 109, 113, 109, 110, 110, 111, 111, 111, 111, 112, \
112, 110, 112, 113, 111, 111, 113, 112, 113, 113, 114, 115, 113, 114, 114, \
122, 117, 119, 114, 115, 115, 114, 114, 113, 114, 114, 114, 116, 116, 115, \
114, 114, 115, 115, 115, 114, 114, 114, 116, 115, 116, 117, 116, 116, 116, \
117, 117, 117, 117}

In[81]:= DeleteCases[euinfo*data5[[2, 1, 1, 8 ;; 71, 6]], 0, Infinity]

Out[81]= {109, 110, 109, 112, 111, 112, 122, 115, 115, 114, 115, 117}

In[82]:= euAvg = Mean[DeleteCases[euinfo*data5[[2, 1, 1, 8 ;; 71, 6]], 0, Infinity]] //
   N

Out[82]= 113.417
Average Age For South America
In[83]:= Do[
 Do[
  If[data6[[kk]] == countriesSA[[jj, 2]], sainfo[[kk]] = 1], {kk, 1,
   Length[data6], 1}
  ], {jj, 1, Length[countriesSA[[;; , 2]]], 1}
 ]

In[84]:= sainfo

Out[84]= {0, 0, 0, 0, 0, 0, 0, 0, 0, 0, 0, 0, 0, 0, 0, 0, 0, 0, 0, 0, 0, 0, 0, 0, 0, \
0, 0, 0, 0, 0, 0, 0, 0, 0, 0, 0, 0, 0, 0, 0, 0, 0, 1, 0, 0, 0, 0, 0, 0, 0, 0, \
0, 1, 0, 0, 0, 0, 0, 0, 0, 0, 0, 0, 0}

In[85]:= DeleteCases[sainfo*data5[[2, 1, 1, 8 ;; 71, 6]], 0, Infinity]

Out[85]= {116, 114}

In[86]:= saAvg = Mean[DeleteCases[sainfo*data5[[2, 1, 1, 8 ;; 71, 6]], 0, Infinity]] //
   N

Out[86]= 115.
Average Age For Africa
In[87]:= Do[
 Do[
  If[data6[[kk]] == countriesAF[[jj, 2]], afinfo[[kk]] = 1], {kk, 1,
   Length[data6], 1}
  ], {jj, 1, Length[countriesAF[[;; , 2]]], 1}
 ]

In[88]:= afAvg = Mean[DeleteCases[afinfo*data5[[2, 1, 1, 8 ;; 71, 6]], 0, Infinity]] //
   N

Out[88]= 111.
Average Age For Asia
In[89]:= Do[
 Do[
  If[data6[[kk]] == countriesAS[[jj, 2]], asinfo[[kk]] = 1], {kk, 1,
   Length[data6], 1}
  ], {jj, 1, Length[countriesAS[[;; , 2]]], 1}
 ]

In[90]:= asAvg = Mean[DeleteCases[asinfo*data5[[2, 1, 1, 8 ;; 71, 6]], 0, Infinity]] //
   N

Out[90]= 114.8
Average Age For Australia
In[91]:= Do[
 Do[
  If[data6[[kk]] == countriesAU[[jj, 2]], auinfo[[kk]] = 1], {kk, 1,
   Length[data6], 1}
  ], {jj, 1, Length[countriesAU[[;; , 2]]], 1}
 ]

In[92]:= auAvg = Mean[DeleteCases[auinfo*data5[[2, 1, 1, 8 ;; 71, 6]], 0, Infinity]] //
   N

Out[92]= Mean[{}]
Average Age For North America
In[93]:= Do[
Do[
If[data6[[kk]] == countriesNA[[jj, 2]], nainfo[[kk]] = 1], {kk, 1,
Length[data6], 1}
], {jj, 1, Length[countriesNA[[;; , 2]]], 1}
]
In[94]:= naAvg = Mean[DeleteCases[nainfo*data5[[2, 1, 1, 8 ;; 71, 6]], 0, Infinity]] //
N
Out[94]= 114.5
In[95]:= data5[[2, 1, 1, 8 ;; 71, 9]]
Out[95]= {"F", "F", "F", "F", "F", "F", "F", "F", "M", "F", "M", "F", "F", "F", "F", \
"F", "F", "F", "F", "F", "F", "F", "F", "F", "F", "M", "F", "F", "F", "F", \
"F", "F", "F", "F", "F", "F", "F", "F", "F", "M", "F", "F", "F", "F", "M", \
"F", "F", "F", "F", "F", "F", "F", "F", "F", "F", "M", "F", "F", "F", "F", \
"F", "F", "F", "F"}
In[96]:= Count[data5[[2, 1, 1, 8 ;; 71, 9]], "M"]
Count[data5[[2, 1, 1, 8 ;; 71, 9]], "F"]
Out[96]= 6
Out[97]= 58
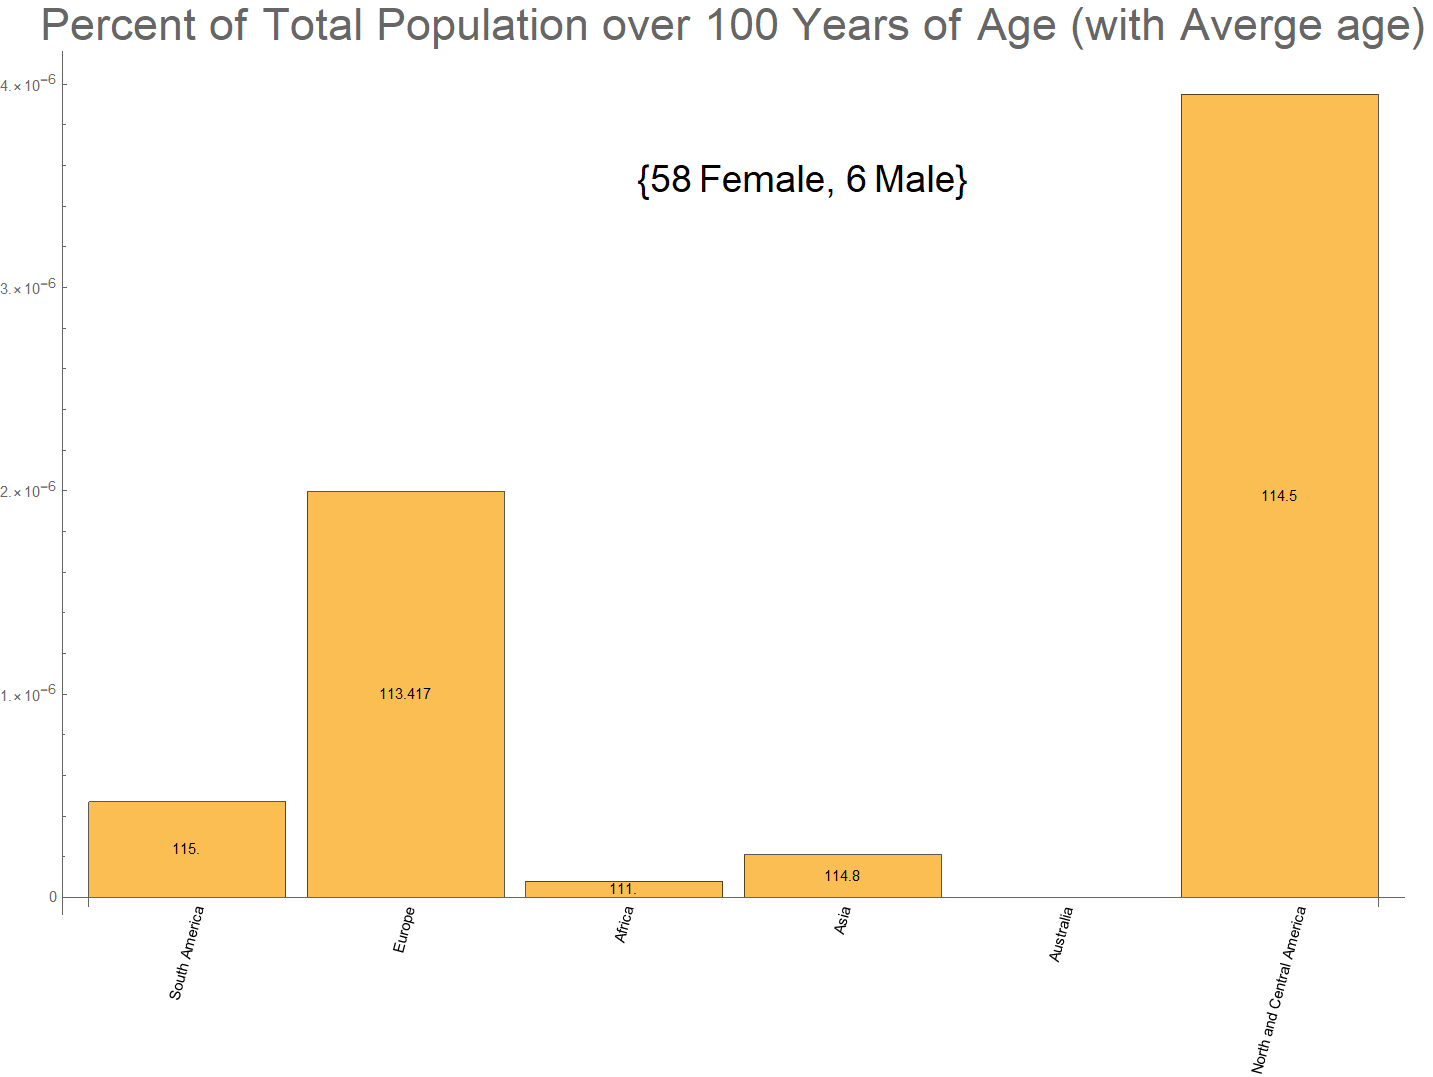
Make the plot
In[98]:=
In[103]:= BarChart[over100percapita[[2, ;;]]*100,
PlotLabel ->
Style["Percent of Total Population over 100 Years of Age (with Averge age)",
30], ChartLabels -> Placed[{over100percapita[[1, ;;]],
{saAvg, euAvg, afAvg, asAvg, "", naAvg} // N},
{Below, Center}, {Rotate[#, Pi/2.4] &, Rotate[#, 0] &}],
Epilog -> {Text[
Style[ {Count[data5[[2, 1, 1, 8 ;; 71, 9]], "F"] "Female",
Count[data5[[2, 1, 1, 8 ;; 71, 9]], "M"] "Male"} , 25],
Scaled[{0.55, 0.85}]], Red, Point@{.5, .5}}]