Message Boards Message Boards

0
|
3705 Views
|
4 Replies
|
3 Total Likes
View groups...
Share
Share this post:

Plot correlation matrix for three lists?

Hi,

Consider three lists as below:

data1 = {11.22, 12.29, 12.97, 14.15, 17.33, 17.60, 16.62, 14.43, 
   13.62, 11.01};

data2 = {12.29, 12.97, 14.15, 17.33, 17.60, 16.625`, 14.43, 13.62, 
   11.01, 9.25};

data3 = {12.97, 14.15, 17.33, 17.60, 16.625`, 14.43, 13.62, 11.016, 
   9.25, 9.48};

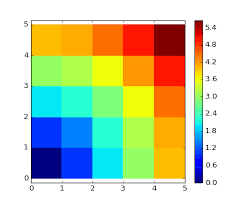
How do I plot a correlation matrix like this:

enter image description here

POSTED BY: M.A. Ghorbani
4 Replies

Try this code

Apply[Correlation,Tuples[{data1,data2,data3},2]//Partition[#,3,3]&,{2}]//MatrixPlot[#,ColorFunction->"DeepSeaColors",PlotLegends->Automatic]&

plot

POSTED BY: Shenghui Yang

Thank you very much.

POSTED BY: M.A. Ghorbani
Correlation[{data1, data2, data3}] // MatrixPlot[#, ColorFunction -> "Rainbow", PlotLegends -> Automatic] &

plot

POSTED BY: Shenghui Yang

Thank you Yang.

Let me know how I can plot the below plot too.

enter image description here

POSTED BY: M.A. Ghorbani
Reply to this discussion
Community posts can be styled and formatted using the Markdown syntax.
Reply Preview
Attachments
Remove
or Discard

Group Abstract Group Abstract