After plotting a polar diagram for Sin 3theta by the following code, some polar ticks are not fully displayed.
PolarPlot[Sin[3 t], {t, 0, 1}, PolarAxes -> Automatic, PolarTicks->{"Degrees", None}]
Does anyone have a same problem?
This behavior is reported. Meanwhile you can use PlotRangePadding:
PlotRangePadding
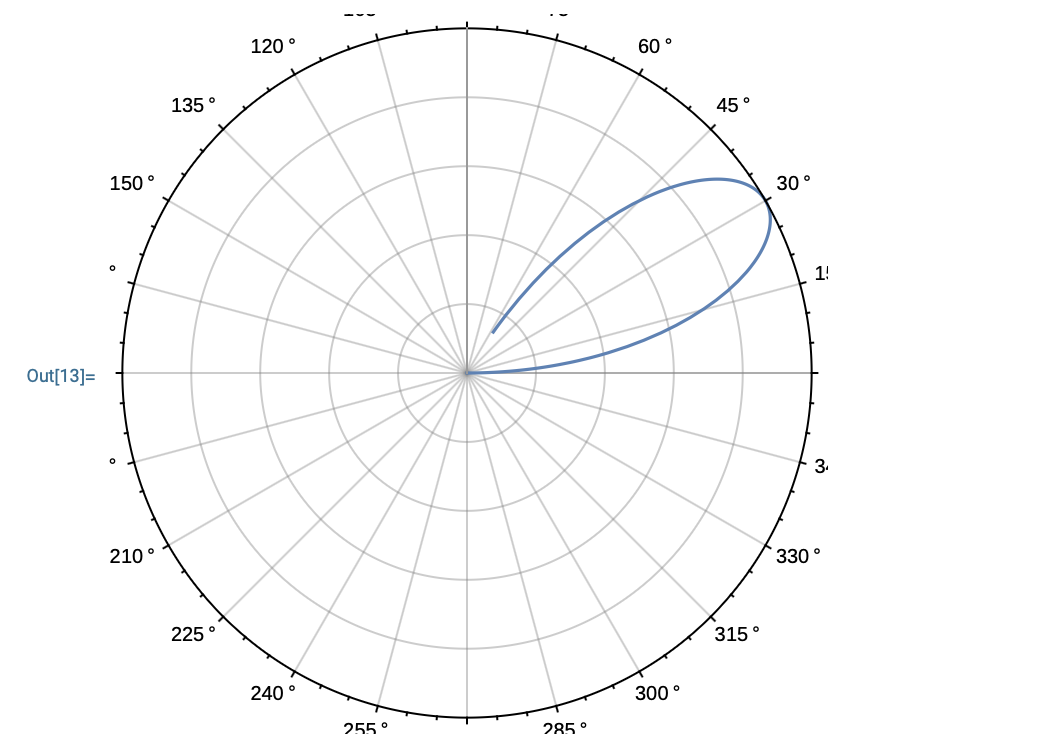
PolarPlot[Sin[3 t], {t, 0, 1}, PlotRangePadding -> Scaled[0.08],
 PolarAxes -> True,
 PolarGridLines -> Automatic,
 PolarTicks -> {"Degrees", None}
 ]