Message Boards Message Boards

[?] Plot Video Conference engagement levels from log files?

Posted 5 years ago

I recently ran a webinar that had a lot of participants. Not all the participants logged in at the start of the event, and not all stayed to the end. The log file contains data on participant numbers in the format

Email, login date/time, logout date/time

I would like to produce a bar chart showing the number of participants logged in by minute, over the 60 minutes of the webinar. I was thinking of doing something like this:

  • Generate Range[60]
  • Sort the Dataset by login date/time
  • For each value in the range, map a function over each record, and if they had not logged out, increment the value in a list for that minute.
  • Plot the list

However, this all seems rather procedural, and given that I am new'ish to Mathematica, I am wondering if there is a much better approach?

POSTED BY: Andrew Burnett
2 Replies
Posted 5 years ago

Thanks Rohini for your wonderfully clear answer. That really helps me get a better understanding of how to approach this problem functionally. Much appreciated

POSTED BY: Andrew Burnett
Posted 5 years ago

A computationally efficient way of solving this kind of problem is to use an Interval Tree. The solution below is essentially what you described expressed in a more functional form.

Generate some random start/end times

SeedRandom[11]; samples = 20;
dateTimes = 
  Table[{DateObject[{2019, 6, 15, 16, k = RandomInteger[{0, 59}]}], 
     DateObject[{2019, 6, 15, 16, RandomInteger[{k, 59}]}]}, 
    samples] // SortBy[First];

minTime = Min[dateTimes];

Generate start/end time minute intervals

intervals = {DateDifference[minTime, First[#], "Minute"], 
      DateDifference[minTime, Last[#], "Minute"]} & /@ dateTimes // 
   QuantityMagnitude // Map[Interval];

Generate 0/1 table of interval membership

data = Table[Boole@IntervalMemberQ[intervals[[i]], j], {i, 1, samples}, {j, 0, 59}];

Count overlaps

counts = Table[Total[data[[All, j]]], {j, 1, 60}];

Plot

ListPlot[counts, Filling -> Axis, ImageSize -> 600]
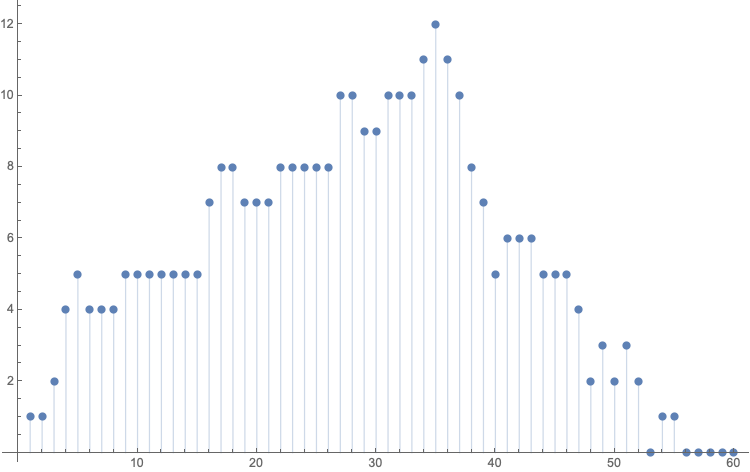
enter image description here

POSTED BY: Rohit Namjoshi
Reply to this discussion
Community posts can be styled and formatted using the Markdown syntax.
Reply Preview
Attachments
Remove
or Discard

Group Abstract Group Abstract