A computationally efficient way of solving this kind of problem is to use an Interval Tree. The solution below is essentially what you described expressed in a more functional form.
Generate some random start/end times
SeedRandom[11]; samples = 20;
dateTimes =
  Table[{DateObject[{2019, 6, 15, 16, k = RandomInteger[{0, 59}]}],
     DateObject[{2019, 6, 15, 16, RandomInteger[{k, 59}]}]},
    samples] // SortBy[First];

minTime = Min[dateTimes];
Generate start/end time minute intervals
intervals = {DateDifference[minTime, First[#], "Minute"],
      DateDifference[minTime, Last[#], "Minute"]} & /@ dateTimes //
   QuantityMagnitude // Map[Interval];
Generate 0/1 table of interval membership
data = Table[Boole@IntervalMemberQ[intervals[[i]], j], {i, 1, samples}, {j, 0, 59}];
Count overlaps
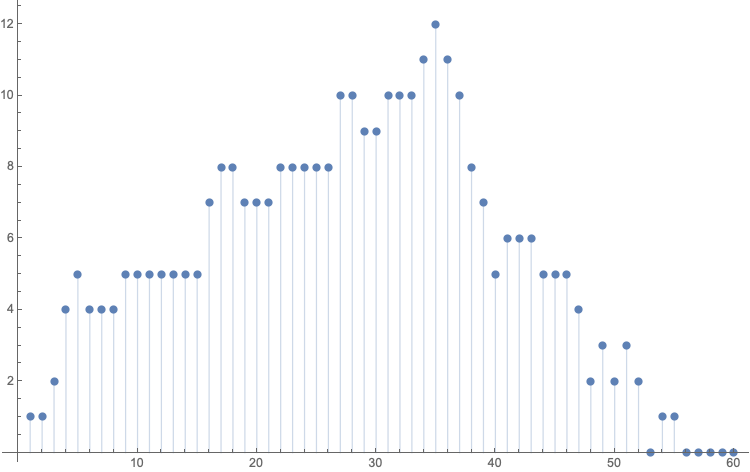
counts = Table[Total[data[[All, j]]], {j, 1, 60}];
Plot
ListPlot[counts, Filling -> Axis, ImageSize -> 600]