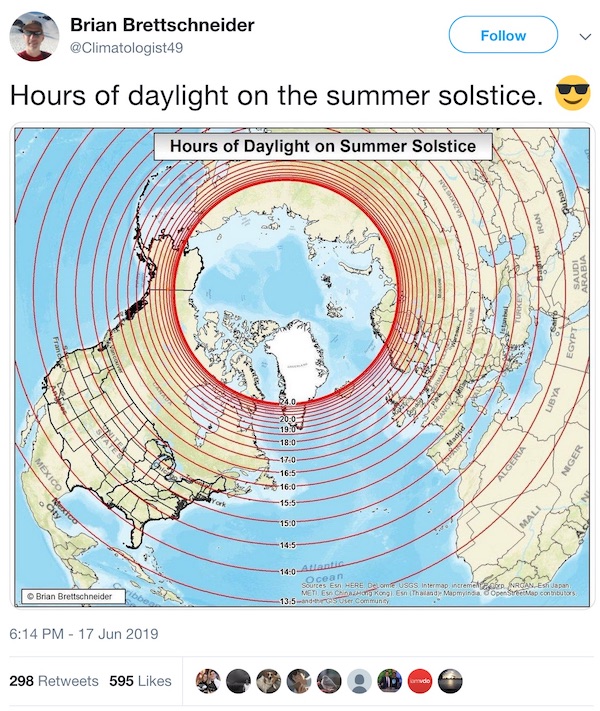
The climatologist Brian Brettschneider shared a nice visualization showing the hours of daylight on the summer solstice.
We can easily create a similar visualization using Wolfram Language. First let's get the date of Summer solstice, from WA:
summerSolstice = DateObject[{2019, 6, 21, 10, 42}, TimeZone -> "America/Chicago"]

Then we construct a function to get the number of hours from sunrise to sunset for a given latitude:
SunriseToSunset[lat_] :=
 Sunset[GeoPosition[{lat, -90}], DateObject[{2019, 6, 21}]] -
  Sunrise[GeoPosition[{lat, -90}], DateObject[{2019, 6, 21}]]
Compute the results for latitudes from the equator to the Arctic Circle:
data = With[{lats = Range[0, 66.5, 1]},
  Transpose[{lats,
    N@QuantityMagnitude[SunriseToSunset /@ lats, "Hours"]}]]
{{0, 12.1167}, {1, 12.1833}, {2, 12.2333}, {3, 12.3}, {4, 12.35}, {5,
12.4167}, {6, 12.4667}, {7, 12.5333}, {8, 12.5833}, {9, 12.65}, {10,
12.7167}, {11, 12.7667}, {12, 12.8333}, {13, 12.8833}, {14,
12.95}, {15, 13.0167}, {16, 13.0833}, {17, 13.15}, {18,
13.2167}, {19, 13.2833}, {20, 13.35}, {21, 13.4167}, {22,
13.4833}, {23, 13.55}, {24, 13.6167}, {25, 13.6833}, {26,
13.7667}, {27, 13.85}, {28, 13.9167}, {29, 14.}, {30, 14.0833}, {31,
14.1667}, {32, 14.25}, {33, 14.3333}, {34, 14.4167}, {35,
14.5167}, {36, 14.6167}, {37, 14.7}, {38, 14.8}, {39, 14.9167}, {40,
15.0167}, {41, 15.1333}, {42, 15.25}, {43, 15.3667}, {44,
15.4833}, {45, 15.6167}, {46, 15.75}, {47, 15.9}, {48, 16.05}, {49,
16.2}, {50, 16.3667}, {51, 16.55}, {52, 16.7333}, {53,
16.9333}, {54, 17.15}, {55, 17.3833}, {56, 17.6167}, {57,
17.8833}, {58, 18.1833}, {59, 18.5167}, {60, 18.8667}, {61,
19.2833}, {62, 19.75}, {63, 20.3167}, {64,
21.0167}, {65, -1.96667}, {66, -0.783333}}
The last two values need 24 hours to be added, because we obtained the sunrise of the next day:
data[[-2]] += {0, 24}
{65, 22.0333}
data[[-1]] += {0, 24}
{66, 23.2167}
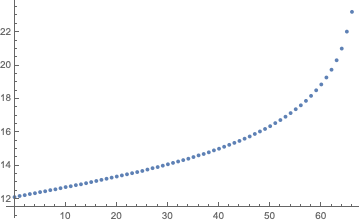
ListPlot[data]
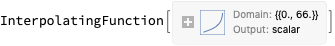
Interpolate that data:
SunriseToSunsetFunction = Interpolation[data]
From this InterpolationFunction object we can find the parallels that correspond to values of 12 to 24 hours of sunlight, in intervals of 30 minutes:
InverseSunriseToSunset[hours_] :=  Block[{lat},
  lat /. FindRoot[SunriseToSunsetFunction[lat] - hours, {lat, 30, 0, 66.56}]]

hours = Range[12, 24, 0.5]
{12., 12.5, 13., 13.5, 14., 14.5, 15., 15.5, 16., 16.5, 17., 17.5,
18., 18.5, 19., 19.5, 20., 20.5, 21., 21.5, 22., 22.5, 23., 23.5, 24.}
Quiet the extrapolation messages:
parallels = Quiet[InverseSunriseToSunset /@ hours]
{0., 6.5, 14.75, 22.25, 29., 34.8377, 39.8359, 44.1294, 47.6667,
50.7311, 53.316, 55.509, 57.4022, 58.9516, 60.3359, 61.4843, 62.4667,
63.2934, 63.9798, 64.5051, 64.9703, 65.4042, 65.8216, 66.2328, 66.56}
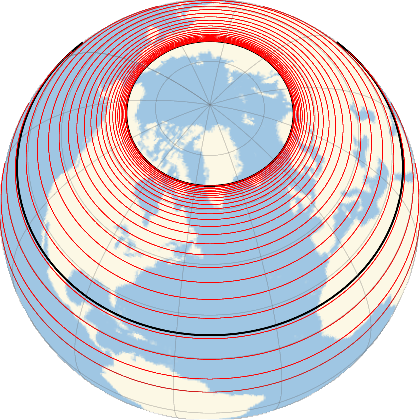
Finally one gets the following map, with tooltips on the parallel lines instead of labels:
GeoGraphics[{Thick, Black, GeoPath["NorthernTropic"],
   GeoPath["ArcticCircle"], Thin, Red,
   Inner[Tooltip, GeoPath[{"Parallel", #}] & /@ parallels, hours, List]},
   GeoProjection -> {"Orthographic", "Centering" -> {60, -50}},
   GeoRange -> "World", GeoGridLines -> Automatic]
|


