Abstract
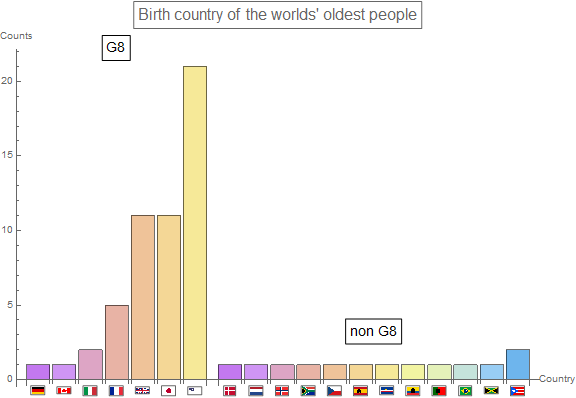
The world's oldest people reflect the underlying medical, technological, and socio-economical conditions of their places of residence. The oldest people on record are ten times more likely to be females than males, supporting the traditional hypothesis that females make less risky social choices. Although all broad racial groups are represented, more than half of the oldest people on record since 1842 are white, and eighty percent was born in G8 countries, indicating the earlier advancement of Western European and North American's healthcare system. Similarly, the oldest people are clustered in Eastern United States, Japan, Britain, and France, justifying the correlation between socio-economical development and increased life-span. Furthermore, the world's oldest people are living longer - by an average of 1.11 years each decade, which demonstrates the overall improvement of global living conditions. The influence of socio-economic conditions on longevity suggests many directions to improve life-span around the world.
I. Data Import
The list of worlds' oldest people, curated by Gerontology Research Group, was imported directly into Wolfram Mathematica using the following code:
ClearAll["Global`*"];
rawData1 = Import["http://archive.is/4kwbk", "Data"];
The data table - the only element of interest from the website - was located by trial and error: it is in the level [[2,2,1]], from position 8 to position 71. In case the data table would be updated in the future, a While loop was implemented to locate the table's last line:
count = 71;
continue = True;
While[And[continue == True, count < Length[rawData1[[2, 1, 1]]]],
  If[NumberQ[First[rawData1[[2, 1, 1]][[count]]]],
   count++,
   continue = False
   ]];
Since the last line of the data table describes the current oldest person, with missing date of death/Most recent alive date, it was separately processed - adding the current date, and manually appended into the table:
rawData2 = Take[rawData1[[2, 1, 1]], {8, count - 2}];
lastLine =
  Insert[rawData1[[2, 1, 1, count - 1]], DateString["ISODate"], 5];
AppendTo[rawData2, lastLine];
This raw data table was not usable, as it contained disparage type of data in one cell or column: separating the years and days of age, mixing up cities and countries, including annotation [] and parentheses () within data. Furthermore, it gave secondary/derived data: age, which could be obtained from date of birth and most recent alive date. Hence, the data was cleaned up:
rawData3 =
  Extract[Transpose[
    Sort[rawData2, #1[[4]] < #2[[4]] &]], {#} & /@ {1, 2, 3, 4, 5, 8,
     9, 10}];
cleanfunc[s_] :=
  StringReplace[
   s, {" [" ~~ x___ ~~ "]" -> "", "(" ~~ x___ ~~ ")" -> x}];
cleanfuncRace[s_] :=
  StringReplace[
   s, {"W" -> "white", "B" -> "black", "EA" -> "asian",
    "O" -> "asian", "M" -> "multiracial", "H" -> "hispanic"}];
cleanfuncSex[s_] := StringReplace[s, {"M" -> "male", "F" -> "female"}];

cleanStrings = {"Que" -> "Quebec", "GA" -> "Georgia",
   "now Poland" -> "", "British West Indies now Jamaica" -> "Jamaica",
    "U.S. MI" -> "Michigan", "Cape Verde Portugal" -> "Cape Verde",
   "France St. Barts" -> "Saint Barthelemy"};
The data table received additional attributes - Date Object or City/Country Entity - thanks to SemanticInterpretation[]. In order to implement SemanticInterpretation[], certain strings were removed or clarified, as detailed above. Nevertheless, SemanticInterpretation[] may fail in some instance, which then requires the re-implementation of the following block of code:
rawData4 =
  Transpose[{rawData3[[1]], cleanfunc[rawData3[[3]]],
    SemanticInterpretation[cleanfunc[rawData3[[4]]]],
    SemanticInterpretation[rawData3[[5]]],
    cleanfuncRace[cleanfunc[rawData3[[6]]]], rawData3[[7]],
    SemanticInterpretation[
     StringReplace[cleanfunc[rawData3[[2]]], cleanStrings]],
    SemanticInterpretation[
     StringReplace[cleanfunc[rawData3[[8]]], cleanStrings]]}];
dataNoHeading =
  Transpose[
   Insert[Transpose[rawData4],
    Table[DateDifference[rawData4[[i, 3]],
      rawData4[[i, 4]], {"Year", "Day"}], {i, 1, Length[rawData4]}],
    5]];

headings = {"No.", "Name", "Date of birth", "Most recent alive date",
   "Age", "Race", "Sex", "Birthplace", "Deathplace"};
data = Prepend[dataNoHeading, headings];

data // TableForm
Upon successful running of SemanticInterpretation[], the data table appeared as follow: 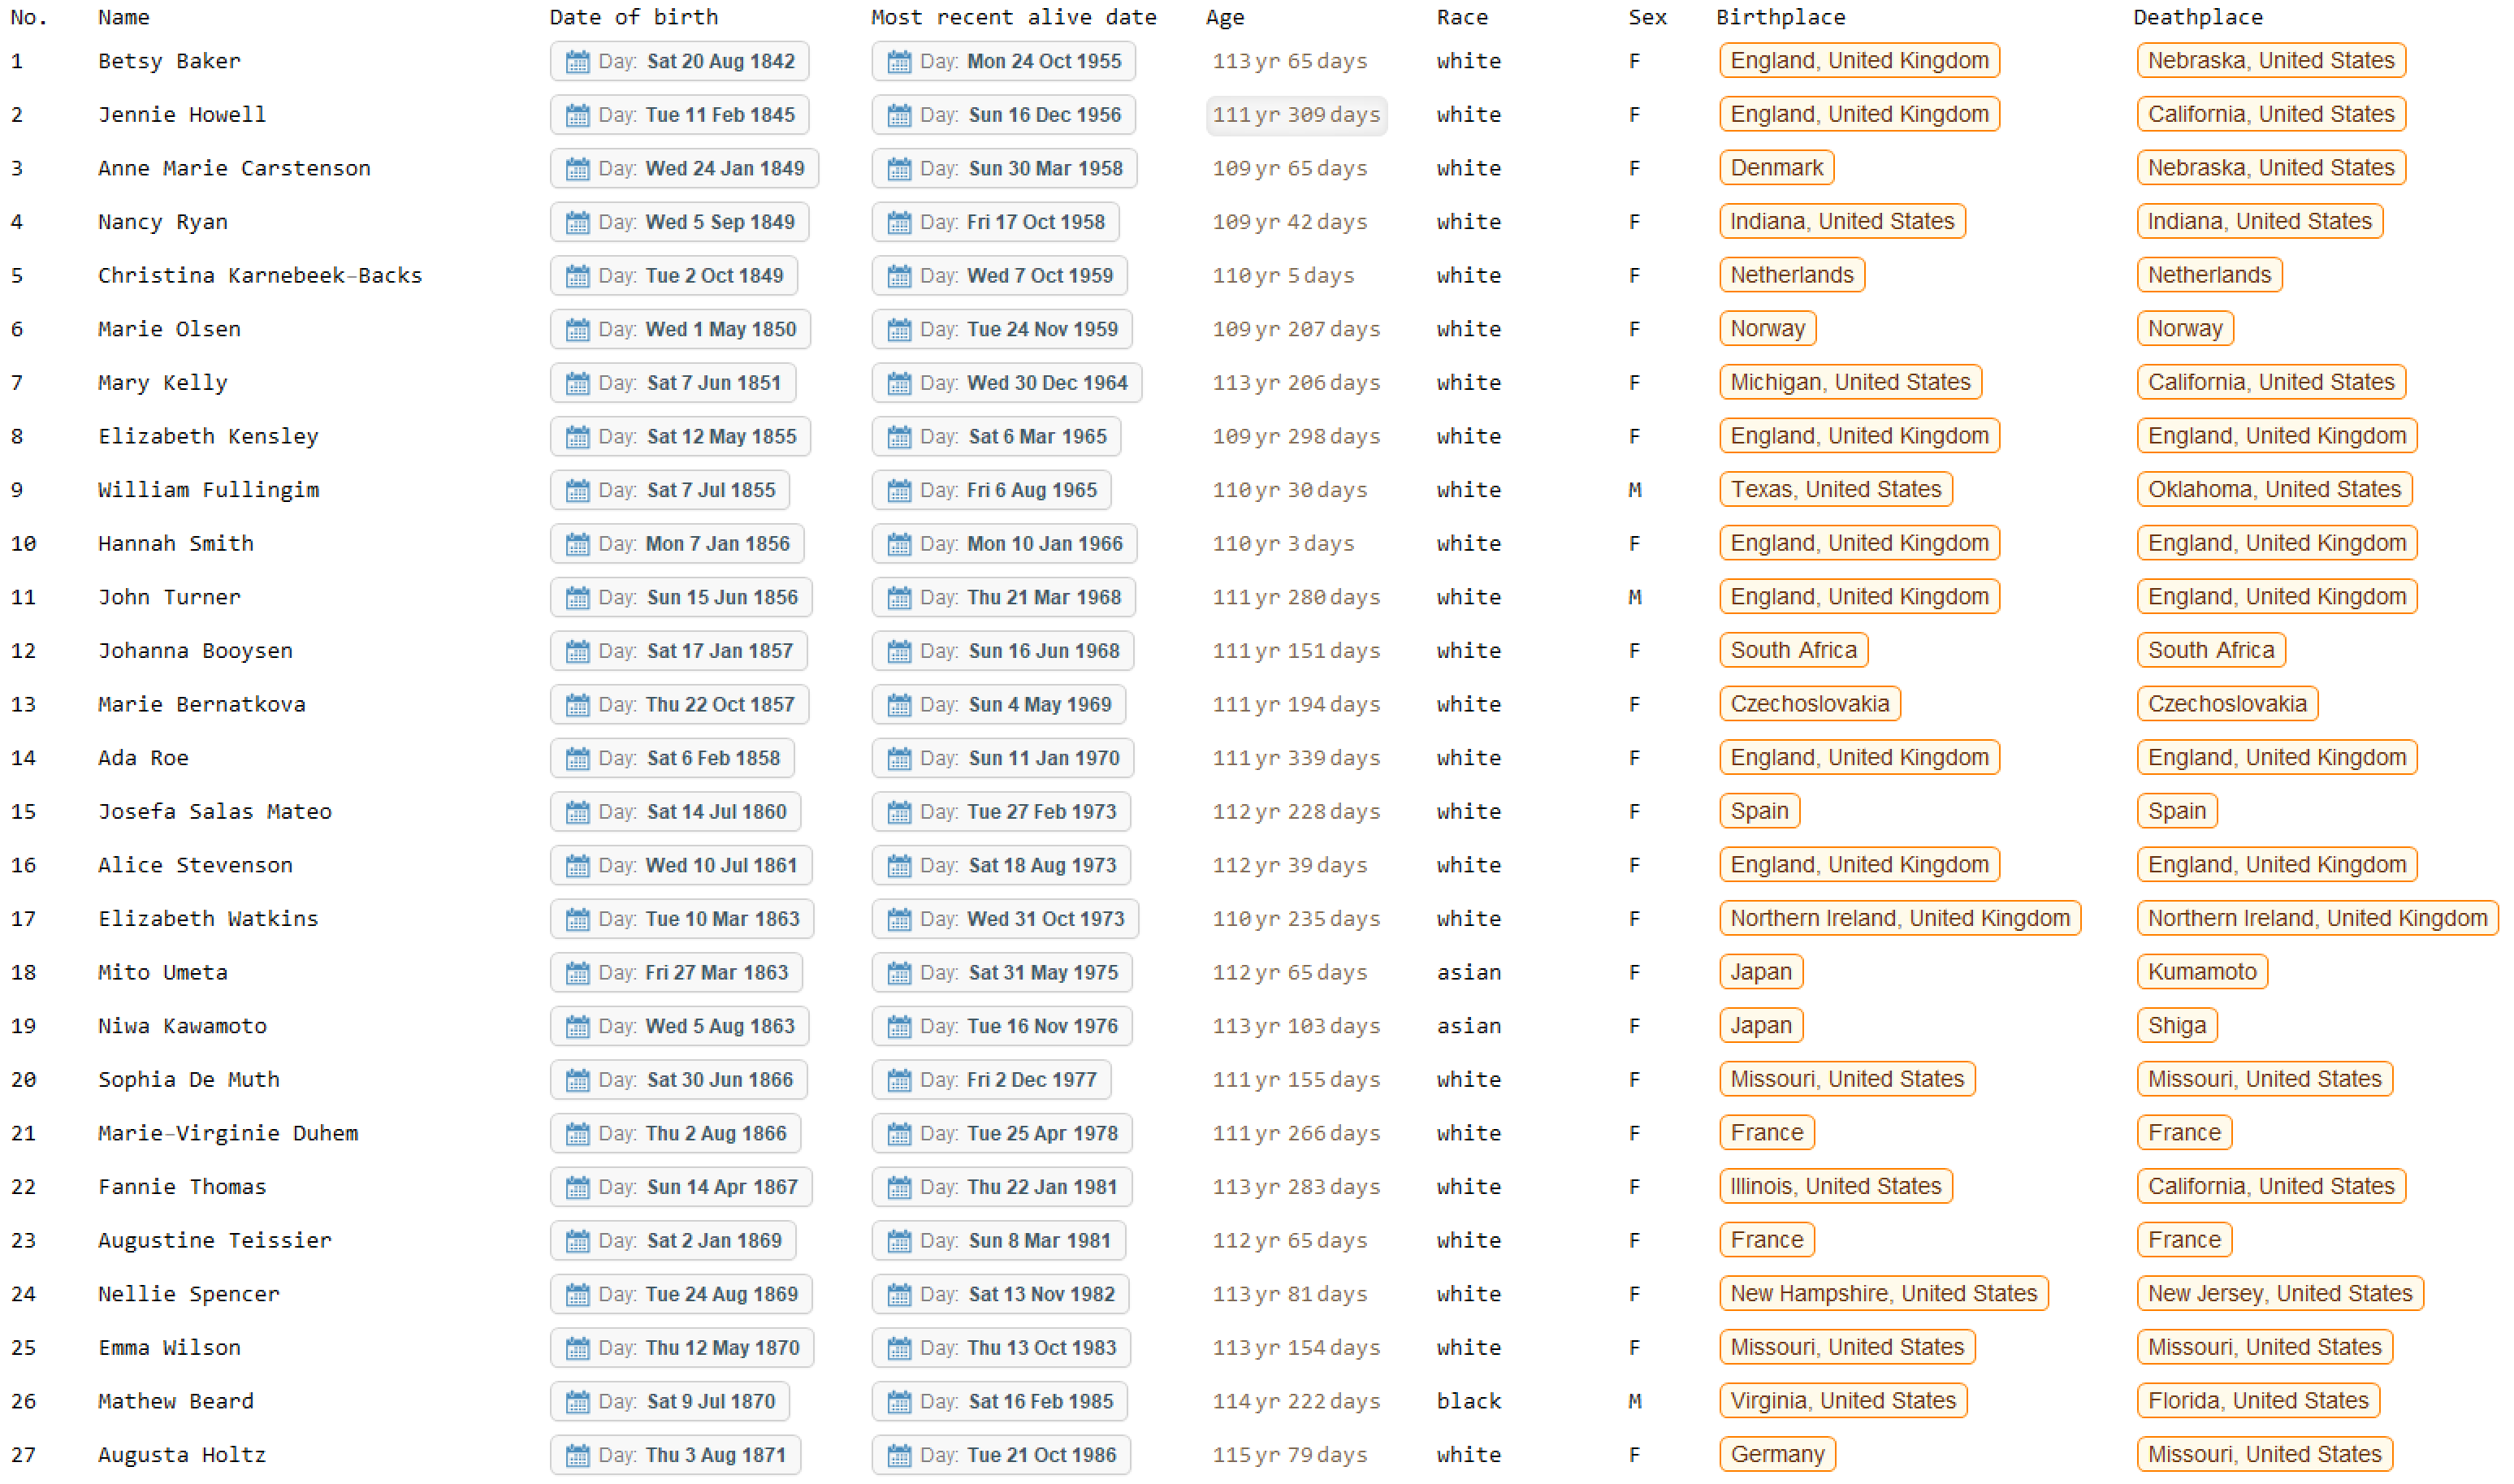
II. Data Visualizations and Analysis
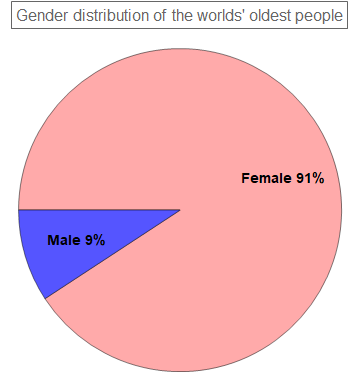
The oldest people are more likely to be women than men, with a ratio of ten-to-one (pieChart1). This discrepancy underscores socio-environmental choices of each gender: men tend to engage in more risky activities: smoking, drinking, using drugs, reckless driving, ignoring health issues, working in dangerous occupations, participating in war, etc. (This gender discrepancy might be attributed to biological differences between male and female also: women were observed to have more resistance to infections and degenerative diseases than men.)
genderCounts =
  Counts[Transpose[dataNoHeading][[7]] //. {"F" -> "Female",
     "M" -> "Male"}];
genderPercentage = genderCounts/Total[Values[genderCounts]];
pieChartLabel1 =
  Table[Style[
    StringJoin[Keys[genderPercentage][[n]], " ",
     ToString[Round[Values[genderPercentage][[n]]*100, 1]], "%"],
    Bold, 14], {n, 1, Length[genderPercentage]}];

pieChart1 =
 PieChart[Counts[Transpose[dataNoHeading][[7]]],
  ChartLabels -> pieChartLabel1,
  ChartStyle -> {Lighter[Pink], Lighter[Blue]},
  PlotLabel ->
   Style[Framed["Gender distribution of the worlds' oldest people"],
    16]]
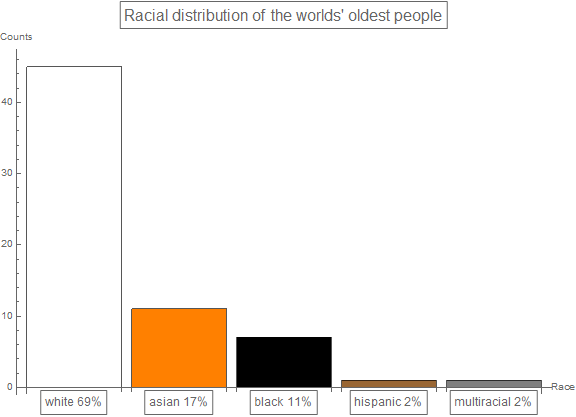
Among all the racial groups - Black, White, Asian, Hispanic, the oldest people are more than half as likely to be White (barChart1). This skewed racial representation may attest to the fact that North American and European countries industrialized earlier than the rest of the world.
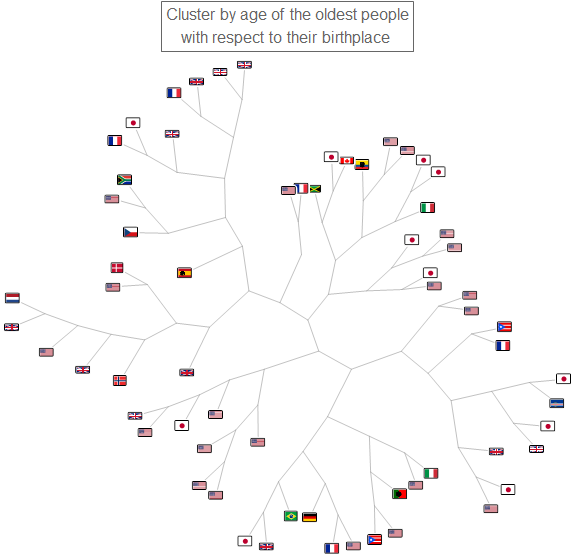
Accordingly, the oldest people are four times as likely to have been born in G8 countries - the more developed, more resourceful nations of the world (barChart2). Furthermore, the oldest people who come from the same country tend to have similar age, which suggests some influence of environmental conditions (clusterImage1).
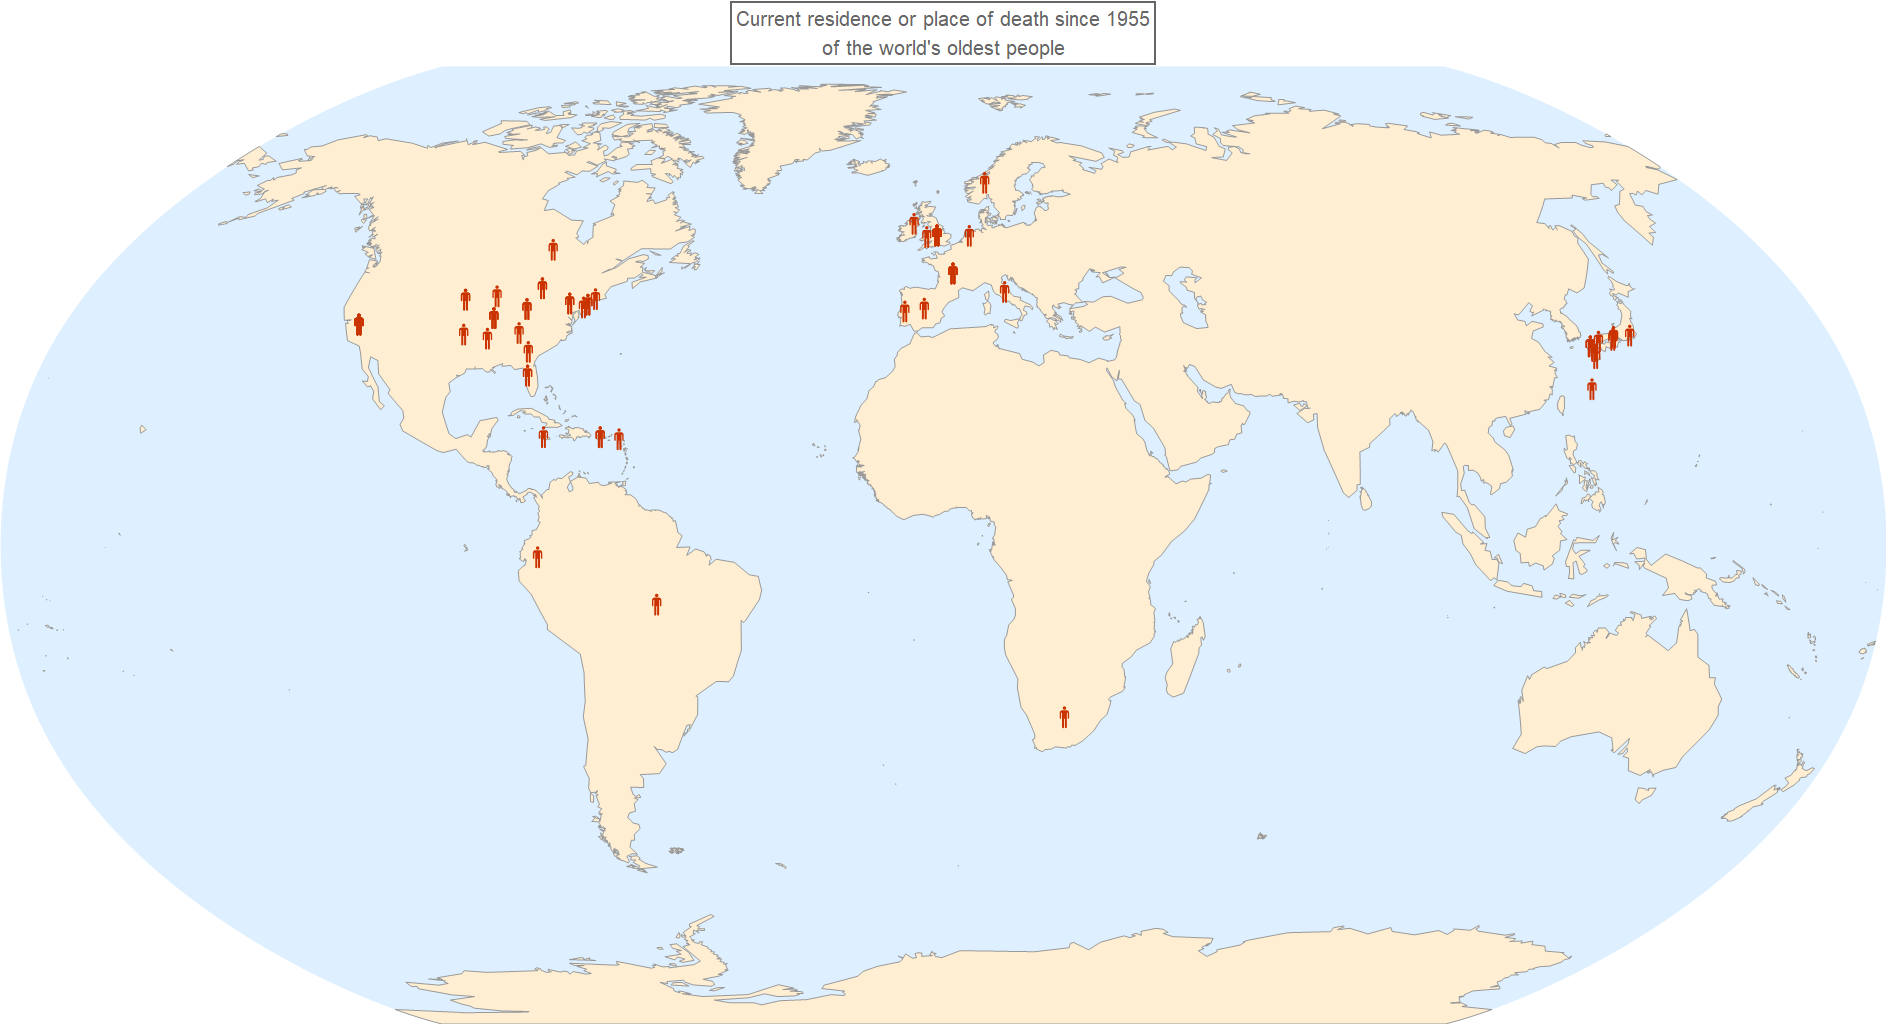
Following the trend, the oldest people's last place of residence tend to cluster around Eastern United States, Europe, or Japan, where advance, life-extending medical services are available. Hence, the racial, place-of-birth, and place-of-death composition of the oldest people all imply that socio-economic conditions greatly affect life-span. (Again, the contribution of genetic, biological factors cannot be discounted - neither is the fact that more develop countries keep better record/census of their people.)
raceCounts = Counts[Transpose[dataNoHeading][[6]]];
racePercentage = raceCounts/Total[Values[raceCounts]];
barChartLabel1 =
  Table[Style[
    Framed[StringJoin[Keys[racePercentage][[n]], " ",
      ToString[Round[Values[racePercentage][[n]]*100, 1]], "%"]
     ], 12], {n, 1, Length[racePercentage]}];
barChart1 =
 BarChart[raceCounts, ChartLabels -> barChartLabel1,
  AxesLabel -> {"Race", "Counts"},
  ChartStyle -> {White, Orange, Black, Brown, Gray},
  PlotLabel ->
   Style[Framed["Racial distribution of the worlds' oldest people"],
    16], ImageSize -> Large]
EntityValue[Entity["HistoricalCountry", "Czechoslovakia"], "Flag"] =
  EntityValue[Entity["Country", "CzechRepublic"], "Flag"];
birthPlaceList = Transpose[dataNoHeading][[8]];
birthCountryList =
  Table[If[EntityTypeName[birthPlaceList[[i]]] == "Country" ||
     EntityTypeName[birthPlaceList[[i]]] == "HistoricalCountry",
    birthPlaceList[[i]], birthPlaceList[[i]]["Country"]], {i, 1,
    Length[birthPlaceList]}];
deathPlaceList = Transpose[dataNoHeading][[9]];
deathCountryList =
  Table[If[EntityTypeName[deathPlaceList[[i]]] == "Country" ||
     EntityTypeName[deathPlaceList[[i]]] == "HistoricalCountry",
    deathPlaceList[[i]], deathPlaceList[[i]]["Country"]], {i, 1,
    Length[deathPlaceList]}];

f[x_] := Magnify[Framed[x], 0.1];
chartList2 =
  Sort[Counts[#]] & /@
   GatherBy[birthCountryList,
    MemberQ[EntityList[EntityClass["Country", "G8"]], #] &];
chartList2Flag = Map[f, EntityValue[Keys[chartList2], "Flag"], {2}];
chartList2ForPlot =
  Table[Table[
    Labeled[chartList2[[n, m]], chartList2Flag[[n, m]]], {m, 1,
     Length[chartList2[[n]]]}], {n, 1, Length[chartList2]}];

barChart2GroupLabel = {Placed[{Style[Framed["G8"], 14],
     Style[Framed["non G8"], 14]}, Above], Automatic};

barChart2 =
 BarChart[chartList2ForPlot, ChartStyle -> "Pastel",
  ChartLabels -> barChart2GroupLabel,
  AxesLabel -> {"Country", "Counts"},
  PlotLabel ->
   Style[Framed["Birth country of the worlds' oldest people"], 16],
  ImageSize -> Large]
clusterFlagLabel =
  Magnify[Framed[#], 0.1] & /@ EntityValue[birthCountryList, "Flag"];
clusterImage1 =
 ClusteringTree[
  UnitConvert[Drop[data[[All, 5]], 1], "Year"] -> clusterFlagLabel,
  ClusterDissimilarityFunction -> "Centroid",
  GraphLayout -> "RadialEmbedding",
  PlotLabel ->
   Style[Framed[
     "Cluster by age of the oldest people\nwith respect to their \
birthplace "], 16], ImageSize -> Large]
mapPlot1 =
 GeoGraphics[{GeoMarker[deathPlaceList,
    EntityValue[Entity["Icon", "MensRoom"], "Image"]]},
  GeoRange -> "World", GeoBackground -> "Coastlines",
  GeoProjection -> "Robinson", ImageSize -> Full,
  PlotLabel ->
   Style[Framed[
     "Current residence or place of death since 1955\nof the world's \
oldest people"], 20]]

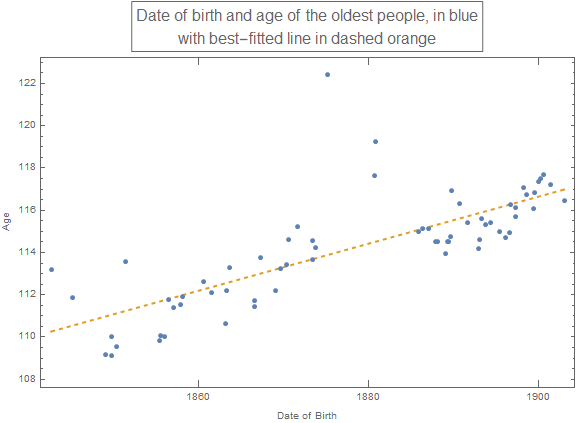
Finally, the oldest people are living longer: the linear model for date of birth and age predicts that age would increase by 1.11 years each decade (listPlot1). This trend of increment in the oldest people's life-span correlates with better living conditions worldwide.
dateOfBirthAgeList =
  TimeSeries[
   Transpose[
    Append[{Transpose[dataNoHeading][[3]]},
     QuantityMagnitude[
      UnitConvert[Transpose[dataNoHeading][[5]], "Year"]]]]];
datePairList = dateOfBirthAgeList["Path"];
modelFit = LinearModelFit[dateOfBirthAgeList, x, x];
modelFitList =
  Table[{x, modelFit[x]}, {x, First[datePairList][[1]],
    Last[datePairList][[1]], (
    Last[datePairList][[1]] - First[datePairList][[1]])/50}];

plotlabel =
  Style[Framed[
    "Date of birth and age of the oldest people, in blue\nwith \
best-fitted line in dashed orange"], 16];
listPlot1 =
 DateListPlot[{dateOfBirthAgeList, modelFitList},
  PlotLabel -> plotlabel, FrameLabel -> {"Date of Birth", "Age"},
  PlotStyle -> {Thick, {Thick, Dashed}}, Joined -> {False, True},
  PlotMarkers -> {All, None}, ImageSize -> Large]

ageDifference = modelFit[10*365.25*24*60*60] - modelFit[0];
rSquare = modelFit["RSquared"];
Print["The best-fitted linear model predicts that the oldest people's \
age would increase by ", ageDifference, " years each decade."];
In conclusion, the oldest people are predominantly women, are mostly white, and are very likely to be born or lived in developed countries. The gender, racial, and geographical distribution of the oldest people show the impact of socio-economical conditions on life-span. The age of the oldest people is increasing, correlating with the overall advances in technology and healthcare.
The correlation between (the number of) oldest people and improved living conditions suggests certain directions to improve life-span in less-developed parts of the world: providing healthcare, improving living conditions, discouraging/alleviating (male) idiosyncratic choices, investing in research and development, etc.
Bonus
Dynamic plot/video of the oldest people:
ClearAll[beginDate, endDate, beginYear, endYear, listLiveDeath,
  listLive, listDeath, plotMap, geoLive, geoGold, geoRed, geoBlue,
  listDate, listDateValue];
beginDate = First[dataNoHeading][[3]] - Quantity[1, "years"];
endDate = Last[data][[4]] + Quantity[0, "years"];
beginYear = DateObject[beginDate, "Year"];
endYear = DateObject[endDate, "Year"];
dayRange = QuantityMagnitude[UnitConvert[endDate - beginDate, "Days"]];
listDate =
  Union[Transpose[dataNoHeading][[3]], Transpose[dataNoHeading][[4]]];
listDateValue =
  QuantityMagnitude[
   UnitConvert[DateDifference[beginDate, #] & /@ listDate, "Days"]];

plotMap[time_] :=
  plotMap[time] =
   Module[{t = time, listDeath, listLive, timeDeathPlaceListDeath,
     timeDeathPlaceListLive, geoLive, geoBlue, plotLabel},
    {listLive =
      Select[dataNoHeading,
       And[QuantityMagnitude[
           DateDifference[#[[3]], beginYear + Quantity[t, "days"]]] >=
           0, QuantityMagnitude[

           DateDifference[#[[4]],
            beginYear + Quantity[t, "days"]]] <=  0] &];
     plotLabel =
      Style[Framed[
        "The world's oldest people who are still alive at time t\n\
Blue: the oldest person, Red: people who are going to be oldest"], 20];

     Which[
      Length[listLive] == 0,
      {GeoGraphics[GeoRange -> "World", GeoBackground -> "Coastlines",
         GeoProjection -> "Robinson", ImageSize -> Full,
        PlotLabel -> plotLabel]
       },

      Length[listLive] == 1,
      {timeDeathPlaceListLive = Transpose[listLive][[9]];
       geoBlue =
        GeoMarker[First[timeDeathPlaceListLive],
         EntityValue[Entity["Icon", "MensRoom"], "Image"],
         "Color" -> Blue, "Scale" -> Scaled[0.04]];
       GeoGraphics[{geoBlue}, GeoRange -> "World",
        GeoBackground -> "Coastlines", GeoProjection -> "Robinson",
        ImageSize -> Full, PlotLabel -> plotLabel]
       },

      Length[listLive] > 1,
      {timeDeathPlaceListLive = Transpose[listLive][[9]];
       geoBlue =
        GeoMarker[First[timeDeathPlaceListLive],
         EntityValue[Entity["Icon", "MensRoom"], "Image"],
         "Color" -> Blue, "Scale" -> Scaled[0.04]];
       geoLive =
        GeoMarker[Drop[timeDeathPlaceListLive, 1],
         EntityValue[Entity["Icon", "MensRoom"], "Image"]];
       GeoGraphics[{geoBlue, geoLive}, GeoRange -> "World",
        GeoBackground -> "Coastlines", GeoProjection -> "Robinson",
        ImageSize -> Full, PlotLabel -> plotLabel]
       }]
     }];
Table[plotMap[t], {t, listDateValue}];

Hold[
  plotMap[time_] :=
   plotMap[time] =
    Module[{t = time, listDeath, listLive, timeDeathPlaceListDeath,
      timeDeathPlaceListLive, geoLive},
     {listLive =
       Select[dataNoHeading,
        And[QuantityMagnitude[
            DateDifference[#[[3]],
             beginYear + Quantity[t, "days"]]] >= 0,
          QuantityMagnitude[
            DateDifference[#[[4]],
             beginYear + Quantity[t, "days"]]] <=  0] &];
      If[listLive == {},
       {GeoGraphics[GeoRange -> "World",
         GeoBackground -> "Coastlines", GeoProjection -> "Robinson",
         ImageSize -> Full,
         PlotLabel ->
          Style[Framed[
            "The world's oldest people who are still alive at time \
t"], 20]]},

       {timeDeathPlaceListLive = Transpose[listLive][[9]];
        geoLive = {GeoMarker[timeDeathPlaceListLive,
           EntityValue[Entity["Icon", "MensRoom"], "Image"]]};
        GeoGraphics[geoLive, GeoRange -> "World",
         GeoBackground -> "Coastlines", GeoProjection -> "Robinson",
         ImageSize -> Full,
         PlotLabel ->
          Style[Framed[
            "The world's oldest people who are still alive at time \
t"], 20]]
        }]
      }];
  Table[plotMap[t], {t, 0, dayRange, 2000}];
  ];

mapAnimate =
 Animate[plotMap[t], {t, listDateValue}, DefaultDuration -> 20,
  AnimationRunning -> False]