StepMonitor or EvaluationMonitor can be used to print the results of calculations.
Simple example: sum of squares of the residuals, using the values of a and b from the most recent step:
In[1]:= data = {{0, 1}, {1, 0}, {3, 2}, {5, 4}, {6, 4}, {7, 5}};
In[2]:= nlm = NonlinearModelFit[data, Log[a + b*x^2], {a, b}, x,
StepMonitor :> Print[
Total[(data[[All,2]] - (Log[a + b*x^2] /. {x -> data[[All,1]]}))^2]]]
2.64897
2.63049
2.63047
2.63047
...
Unadjusted R^2,
In[4]:= nlm = NonlinearModelFit[data, Log[a + b*x^2], {a, b}, x,
StepMonitor :> Print["R^2 = ", 1 -
Total[(data[[All, 2]] - (Log[a + b*x^2] /. {x -> data[[All, 1]]}))^2]/
Total[(data[[All, 2]] - Mean[data[[All, 2]]])^2]
]]
R^2 = 0.862984
R^2 = 0.86394
R^2 = 0.863941
R^2 = 0.863941
...
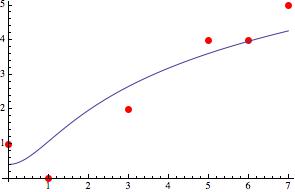
Data and fitted curve.
In[5]:= Show[ListPlot[data, PlotStyle -> {Red, PointSize[Large]}],
Plot[nlm[x], {x, 0, 7}]]

ref:
http://en.wikipedia.org/wiki/Coefficient_of_determination (The formulas are in many places.)