Message Boards Message Boards

0
|
10068 Views
|
3 Replies
|
1 Total Likes
View groups...
Share
Share this post:

Is there a way to monitor progress of NonlinearModelFit?

Posted 11 years ago
Hello,
I am using Mathematica to fit a nonlinear function of several variables to a large set of experimental data (strain as a function of stress and time under load, if it helps to know that). I have been using the NonlinearModelFit function with limited success. Here is my primary question: is there a way to track the progress of the fitting algorithm as it proceeds through the allowed number of iterations? For instance, I would like to watch how the RSquared value of the model changes as the fit progresses.
I have tried putting the fit inside a FOR loop, but I do not think this is a viable option. When I run NonlinearModelFit by itself for 10 iterations, I end up with different values for the model parameters than if I run the FOR loop 10 times with NonlinearModelFit iterating once inside the FOR loop each time, even though both cases technically have the same number of total fitting iterations. I suspect this is because of how the minimization algorithm works during successive iterations, but I have not found this explained anywhere in the Mathematica documentation.
Any suggestions are greatly appreciated!
POSTED BY: J May
3 Replies
The EvaluationMonitor option might be helpful. 
You would have to write a little code to calculate RSquared from the data and the fit so far.
 In[2]:= data = {{0, 1}, {1, 0}, {3, 2}, {5, 4}, {6, 4}, {7, 5}};
 
 In[3]:= nlm = NonlinearModelFit[data, Log[a + b x^2], {a, b}, x,
      EvaluationMonitor :> Print["a=", a, ".    b=", b]  ]
 
 a=1..    b=1.
 a=1.4247.    b=1.34938
 a=1.50416.    b=1.42418
 a=1.50629.    b=1.42634
...
POSTED BY: Bruce Miller
Posted 11 years ago
Bruce,
Thank you for the reply. I am currently using Step Monitor in a way similar to what you suggested with Evaluation Monitor; I output the parameter values as the end of each increment within NonlinearModelFit and store them in an Excel file so I can plot the trend vs. the number of iterations.

I am curious about your suggestion to compute the RSquared value on my own, though. After NonlinearModelFit runs to full number of iterations I allow it to, the AdjustedRSquared parameter is available as a function of the final fitted model. Is there a way for me to access that information 'inside' the fitting algorithm? Presumable, the algorithm uses it, or something similar, to determine whether the fit has converged and/or which parameters to modify in order to move closer to convergence.

Thanks.
POSTED BY: J May
StepMonitor or EvaluationMonitor can be used to print the results of calculations.

Simple example: sum of squares of the residuals, using the values of a and b from the most recent step:
 In[1]:=  data = {{0, 1}, {1, 0}, {3, 2}, {5, 4}, {6, 4}, {7, 5}};
 
 In[2]:= nlm = NonlinearModelFit[data, Log[a + b*x^2], {a, b}, x,
    StepMonitor :> Print[
       Total[(data[[All,2]] - (Log[a + b*x^2] /. {x -> data[[All,1]]}))^2]]]
 
 2.64897
 2.63049
 2.63047
2.63047
...
 

Unadjusted R^2,
 In[4]:= nlm = NonlinearModelFit[data, Log[a + b*x^2], {a, b}, x,
      StepMonitor :> Print["R^2 = ",  1 -
           Total[(data[[All, 2]] - (Log[a + b*x^2] /. {x -> data[[All, 1]]}))^2]/
           Total[(data[[All, 2]] - Mean[data[[All, 2]]])^2]
     ]]
 
 R^2 = 0.862984
 R^2 = 0.86394
 R^2 = 0.863941
R^2 = 0.863941
...


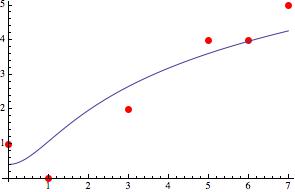
Data and fitted curve. 
In[5]:= Show[ListPlot[data, PlotStyle -> {Red, PointSize[Large]}],
Plot[nlm[x], {x, 0, 7}]]


ref: http://en.wikipedia.org/wiki/Coefficient_of_determination (The formulas are in many places.)
POSTED BY: Bruce Miller
Reply to this discussion
Community posts can be styled and formatted using the Markdown syntax.
Reply Preview
Attachments
Remove
or Discard

Group Abstract Group Abstract